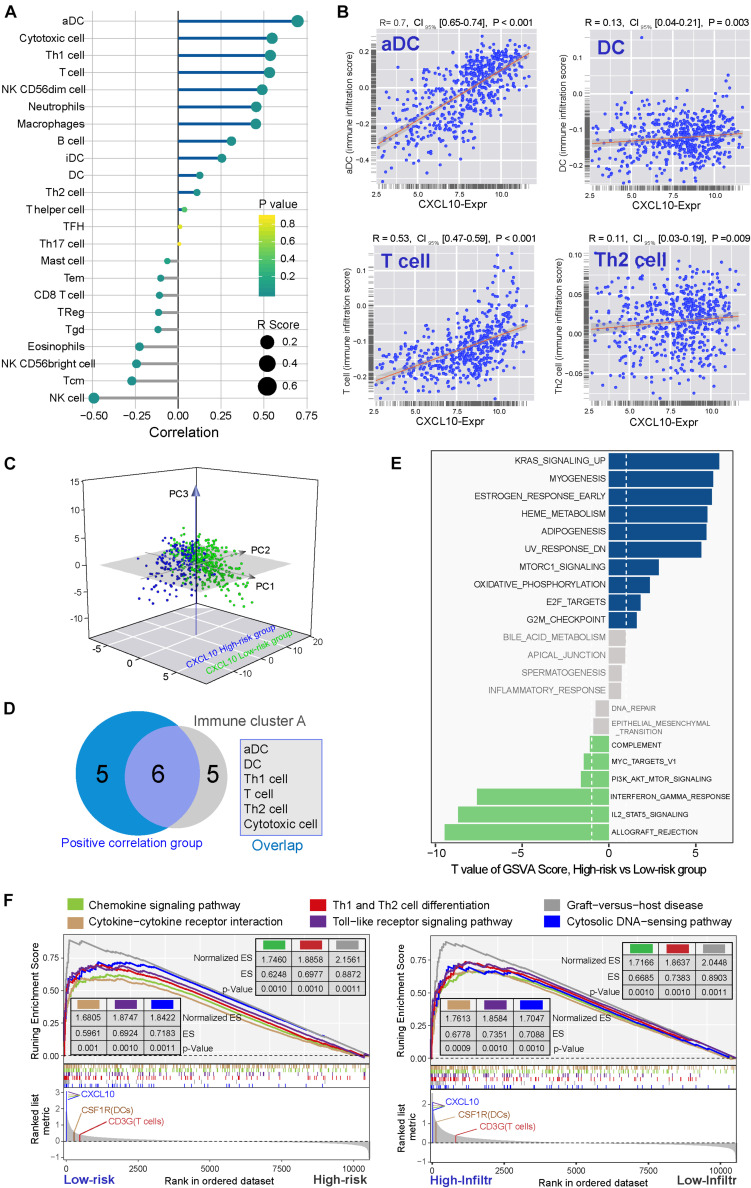
FIGURE 3.
TME immune cells transcriptome traits in TCGA-Ovarian Cancer. (A) Correlation between CXCL10 and known TME immune cell infiltration in standard cohort was analyzed by Spearman. Positive correlation was marked with right arms (blue), and negative correlation was marked with left arms (gray). The circles size and color were represented the R score and P value. (B) Scatter plots depicted the positive correlation between CXCL10 expression and four particularly interested immune cells. (C) Venn diagram showed the overlap of immune cells between immune cluster-A and CXCL10 positive correlation group. We filtered six cells to further analysis CXCL10-related underlying mechanism. (D) PCA was used for the expression profiles of high- and low-risk classifications to distinguish selected immune signature gene sets. These signature genes expression was well distinguished based on the different risk classifications. High risk classification marked with blue, and low risk classification marked with green. (E) Differences in pathway activities. The 135 selected immune signature genes expression between high-risk and low-risk classifications were analyzed by GSVA. T values are from a linear model, ultimately correcting the effects from the patient of origin. The KRAS signaling-up was marked in high-risk classification, and IL2-STAT5 signaling was marked in low-risk classification. (F) GSEA of the whole genome expression data from TCGA ovarian cancer in low- to high-risk classification and high- to low-infiltration patients. The enrichment results with immune associations between low-risk classification and high TME cells-infiltration are shown. P values were determined by using the Kolmogorov–Smirnov test.

