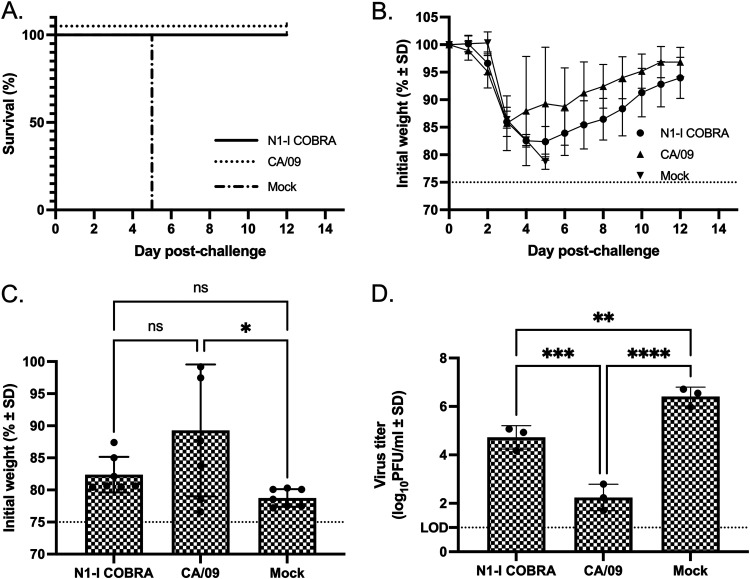
FIG 4.
A/California/07/2009 (H1N1)pdm09 challenge results after vaccination with NA antigens. (A and B) Survival (A) and weight loss (B) curves of mice postinfection are shown. (C) The day 5 peak weight loss of the CA/09-vaccinated mice was significantly different than the mock vaccinated. The variation of the CA/09 NA-vaccinated group was greater than the N1-I-vaccinated group. (D) The viral lung titers determined through plaque assay from lung tissue on day 3 postinfection. All error bars depict standard deviations, and the statistical analysis was conducted using a one-way ANOVA with Tukey’s multiple comparison. Not significant (ns); P value < 0.05 (*); P value < 0.01 (**); P value < 0.001 (***); P value < 0.0001 (****).

