FIG 8.
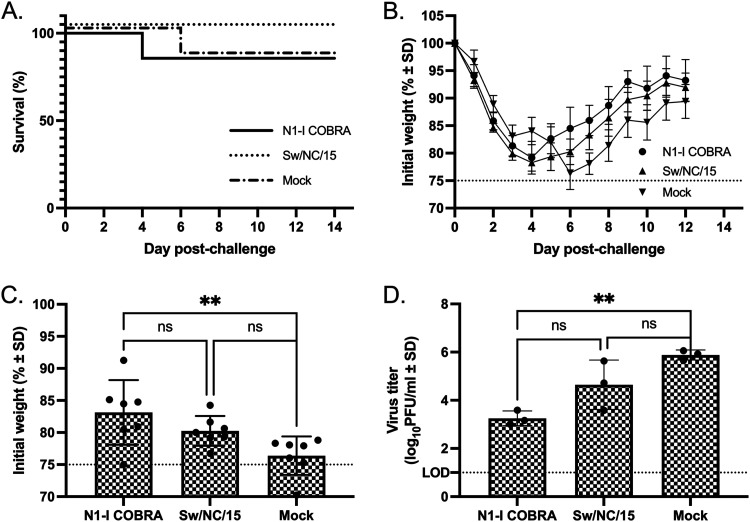
A/Swine/North Carolina/154074/2015 (H1N1) challenge results after vaccination with NA antigens. (A and B) Survival (A) and weight loss (B) curves of mice postinfection. (C) The day 6 peak weight loss was significantly different between the N1-I COBRA and mock groups. The weights that reached humane endpoint before day 6 were analyzed at the limit of detection (75% body weight). (D) Viral lung titers were determined through plaque assay from lung tissue on day 3 postinfection. All error bars depict standard deviations, and the statistical analysis was conducted using a one-way ANOVA with Tukey’s multiple comparison. Not significant (ns); P value < 0.01 (**).

