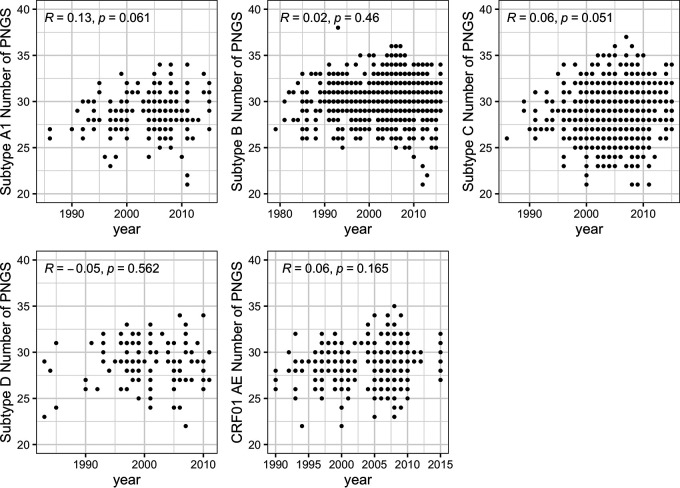
FIG 3.
No variation in the number of PNGS in Env sequences sampled since the beginning of the epidemic. The relationship between numbers of PNGS and time was calculated using Spearman’s correlations. Similar patterns were seen across HIV-1 subtypes. The number of independent sequences sampled per subtype varied between 116 (subtype D) and 1184 (subtype C) sequences. The figure shows Spearman’s ρ and P values.

