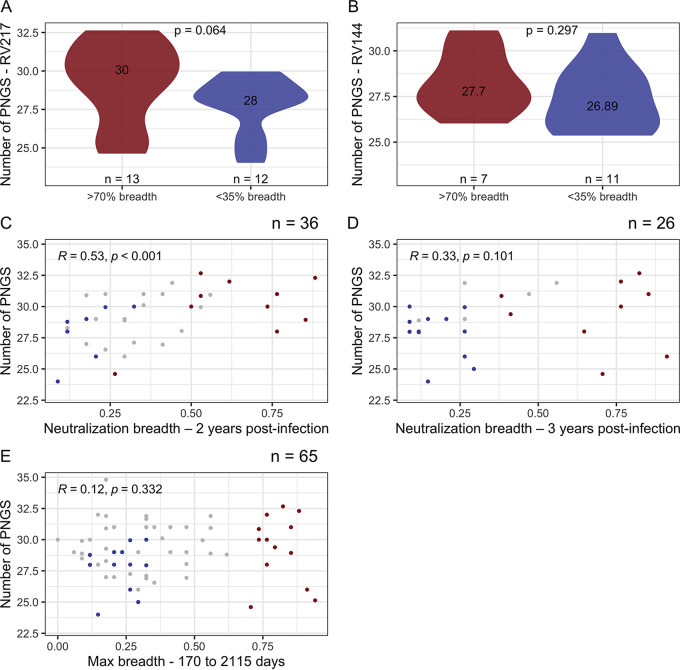
FIG 6.
Relationship between number of PNGS and neutralization breadth. The number of PNGS identified in Env sequences during acute HIV-1 infection in RV217 (A) and at diagnosis in RV144 (B) participants was compared across participants who developed neutralization breadth (greater than 70% of the 34-virus panel, in red) or not (<35% of the 34-virus panel, in blue). The figures show the number of participants and median values for each group, along with P values for Mann-Whitney tests. The relationship between numbers of PNGS during acute infection and neutralization breadth measured 2 years (C), 3 years postinfection (D), or at peak breadth (E) was calculated using Spearman’s correlations, including all participants’ data in RV217. The correlation between increased breadth for Env with high numbers of PNGS observed 2 years after infection was not seen 3 years after infection or at peak breadth. The peak breadth measurements occurred between 170 and 2,115 days after diagnosis. The figures show Spearman’s ρ and P values, along with the number of individuals in each subgroup.

