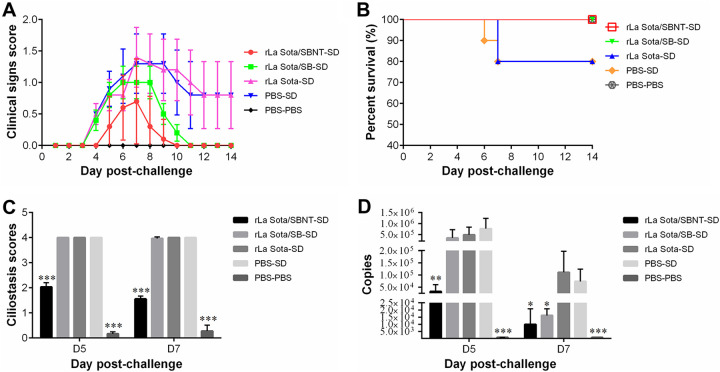
FIG 7.
The protective efficacy of IBV multi-epitope vaccine candidates against homologous IBV challenge. (A) Clinical sign scores of each group after challenge with IBV SD strain. The chickens were monitored daily for 14 days and assigned clinical sign scores (0 for normal; 1 for slight shaking, slight nasal discharge, and slight lacrimation; 2 for depression, watery feces, and sneezing or coughing; 3 for heavy depression, heavy nasal discharge, tracheal rales, or mouth breathing; and 4 for death). Line chart displays the mean ± standard deviation. (B) Survival curve showing the survival percentage in each group during the 14-day observation period. (C) Tracheal ciliostasis scores. Tracheal ciliary activity was assessed and scored at 5 and 7 dpc using the scoring system described in Materials and Methods. Bar graph displays the mean ± standard deviation. (D) Tracheal swab samples were collected from each group at 5 and 7 dpc, and the viral loads in these swab samples were determined by real-time RT-qPCR. Bar graph displays the mean ± standard deviation. Statistically significant differences versus the PBS-SD group are indicated as follows: *, P < 0.05; **, P < 0.01; ***, P < 0.001.

