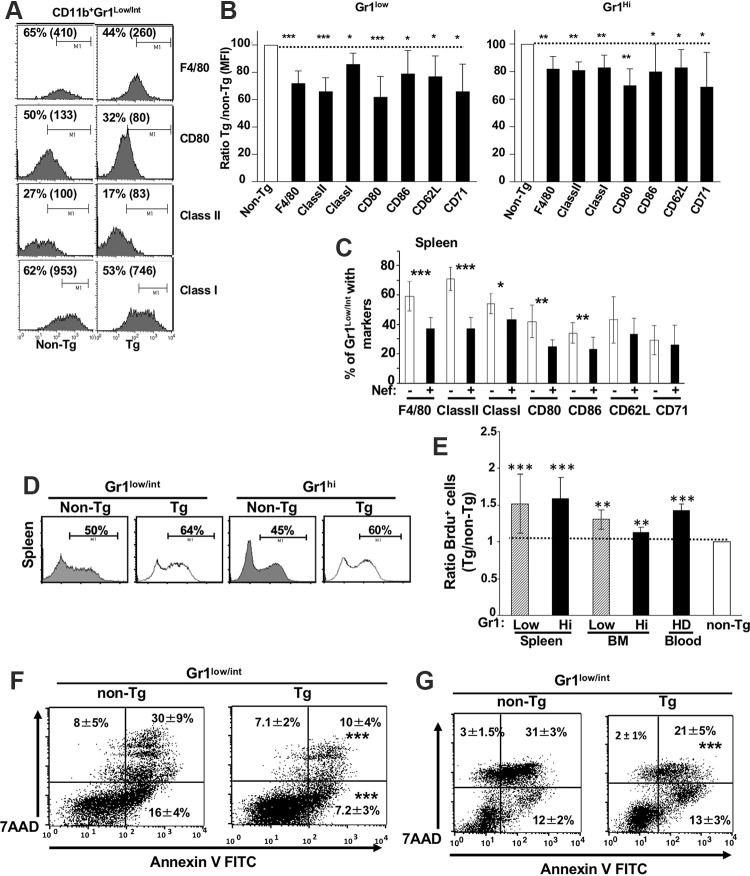
FIG 2.
Analysis of maturation/activation markers, proliferation, and death/apoptosis of CD11b+ Gr1+ cell subsets from CD11c/Nef Tg mice. (A to C) Representative FACS profiles (A) and mean fluorescence intensity (MFI) (B) of the indicated cell surface markers on CD11b+ Gr1low and CD11b+ Gr1hi spleen cells from Tg (n = 15) and non-Tg (n = 15) mice and quantification (C) of the percentage spleen CD11b+ GR1low cells from Tg (+) and non-Tg (−) mice expressing the indicated cell surface markers. (D and E) Representative FACS profiles (D) and calculated ratios (Tg/non-Tg) of percentage (E) of purified BrdU-positive CD11c-negative CD11b+ Gr1+ cells in spleen, BM, and blood of Tg and non-Tg mice. Blood HD cells are from a high-density Ficoll gradient. A value of 1 was assigned to non-Tg cells. Results are from three independent experiments. (F and G) Representative FACS profiles of apoptotic/dead cells and quantification of percentage of spleen CD11b+ Gr1low/int cell subsets ex vivo (F) or of purified CD11b+ Gr1low spleen cells cultured in vitro for 24 h in the presence of LPS (G). Cells were stained for cell surface CD11c, CD11b, Gr1, 7-AAD, and annexin V and gated on CD11c-negative cells. Statistical analysis was performed using Student’s t test (*, P ≤ 0.05; **, P ≤ 0.01; ***, P ≤ 0.001).

