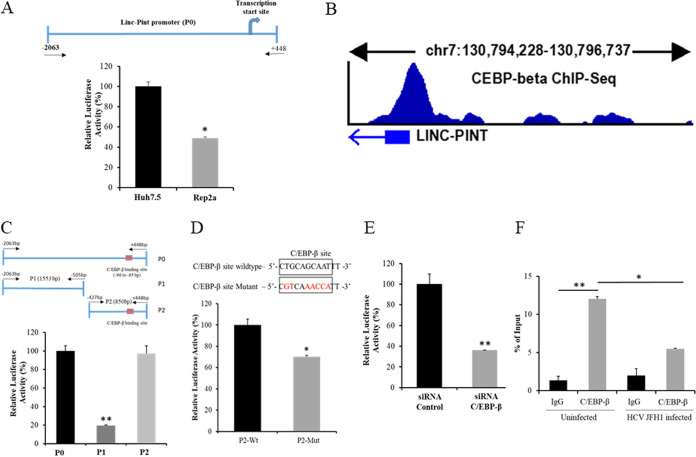
FIG 1.
HCV inhibits C/EBP-β transcription factor binding to the Linc-Pint promoter region. (A) Schematic diagram of the Linc-Pint full-length promoter region cloned into the pGL3 Basic plasmid (P0). Huh7.5 and Rep2a cells were transfected with the Linc-Pint promoter construct (P0). Promoter activity was measured by a luciferase assay after 48 h of transfection. (B) In silico analysis using the NIH ENCODE data set of C/EBP-β ChIP-Seq signals from HepG2 cells. The result was analyzed from the data set under GEO accession number GSM935622. (C) Schematic diagram of the two deletion mutant constructs of the Linc-Pint promoter. Red boxes show the C/EBP-β binding site (bp −95 to −85). Huh7.5 cells were transfected with Linc-Pint promoter constructs (P0, P1, and P2), and promoter activity was measured by a luciferase assay after 48 h of transfection. (D) Nucleotide sequence of the wild-type (Wt) and mutant C/EBP-β binding sites (top). Changed nucleotides are shown in red. Huh7.5 cells were transfected with the P2 wild-type or mutant promoter construct, and luciferase activity was measured after 48 h of transfection. (E) Linc-Pint P0 promoter construct-transfected Huh7.5 cells were depleted of C/EBP-β using a specific siRNA, and promoter activity was measured by a relative luciferase assay after 48 h of transfection. (F) ChIP analysis of C/EBP-β binding to the Linc-Pint promoter. Huh7.5 cells were mock treated or infected with HCV JFH1 (MOI = 1.0) for 24 h. ChIP analysis was then performed using IgG (negative control) and C/EBP-β antibody. The relative enrichment of Linc-Pint promoter DNA was normalized to the input DNA (5%) for each experiment. Data are presented as means ± SD from three independent experiments. Statistical significance was analyzed using two-tailed Student’s t test. *, P < 0.05; **, P < 0.01.

