FIG 3.
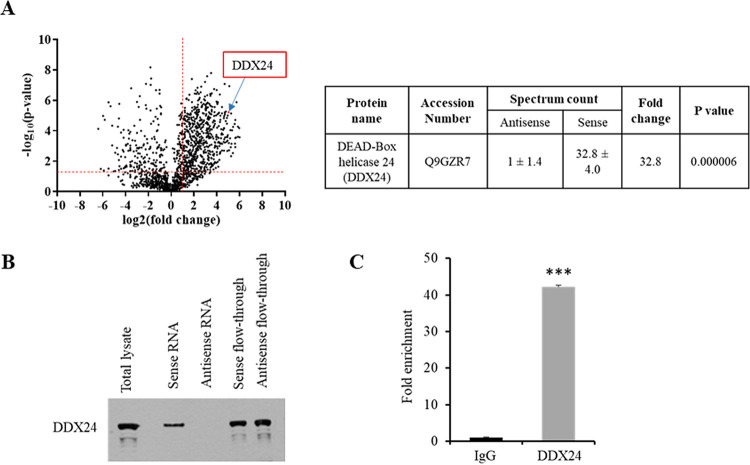
Linc-Pint interacts with DDX24. (A, left) Volcano plot from the mass spectrometry data demonstrating the magnitude and significance of the proteins interacting with the sense strand of Linc-Pint compared with the antisense strand of Linc-Pint. The x axis is the log2(fold change) value, and the y axis is the −log10(P value) showing statistical significance. The horizontal dashed red line shows a P value of 0.05 [−log10(0.05) = 1.3], and the vertical dashed red line shows a fold change of 2 [log2(2) = 1]. An absolute 2-fold change and a P value of 0.05 are used as the threshold cutoffs. (Right) Spectrum counts of antisense or sense Linc-Pint RNA for DDX24 from mass spectrometry data. (B) Western blot analysis was performed from sense or antisense Linc-Pint RNA pulled down from Huh7.5 lysates using a specific antibody, and the presence of DDX24 is shown. (C) Lysates from Huh7.5 cells were immunoprecipitated using isotype control or DDX24 antibody. RNA was isolated from the immunoprecipitated samples, and Linc-Pint RNA enrichment was evaluated by qRT-PCR. Data are presented as means ± SD from three independent experiments. Statistical significance was analyzed using two-tailed Student’s t test. ***, P < 0.001.

