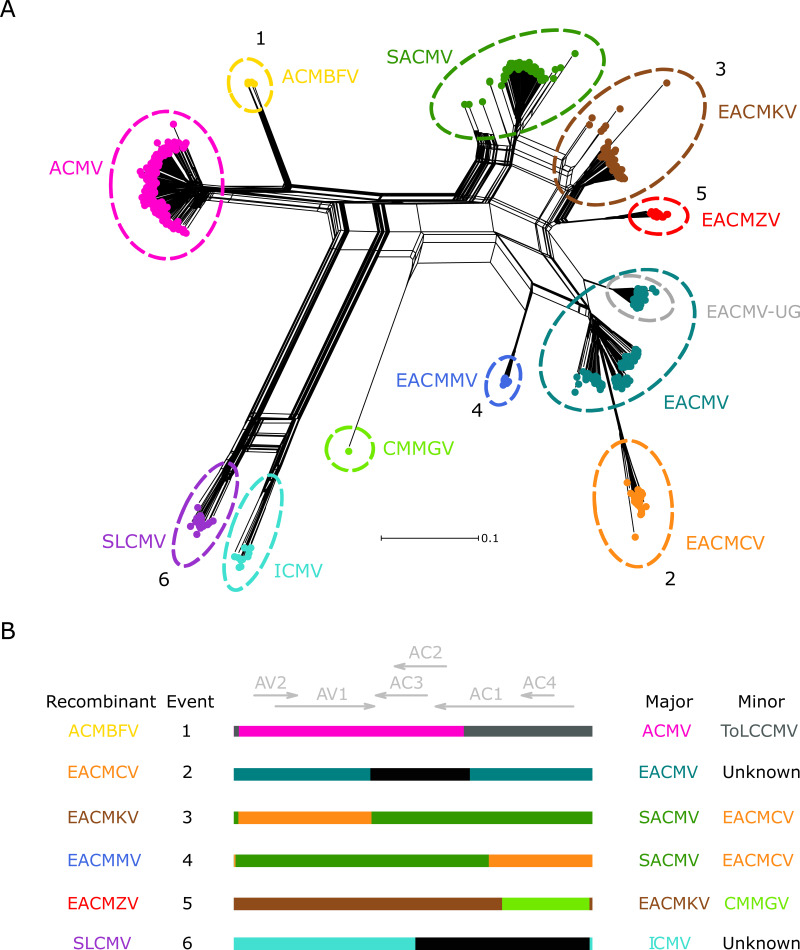
FIG 1.
Phylogenetic network analysis for all CMB species DNA-A segments and schematic of identified macroevolutionary recombination events. (A) Neighbor-Net network analysis for all CMB species DNA-A segments. Distances were transformed using a GTR + G model. The numbers correspond to the clade-wide events shared by all members of a species reported in Table 2 and depicted in panel B. Colors representing each species are the following: ACMV, pink; ACMBFV, yellow; SACMV, green; EACMKV, brown; EACMZV, red; EACMV, teal; EACMCV, orange; EACMMV, blue; CMMGV, spring green; ICMV, turquoise; SLCMV, purple. The descendants of a well-studied recombination event between ACMV and EACMV (EACMV-UG) are circled in gray. (B) Linearized DNA-A schematic representations of putative ancestral recombination events based on breakpoint and parental species predicted by RDP4.

