FIG 2.
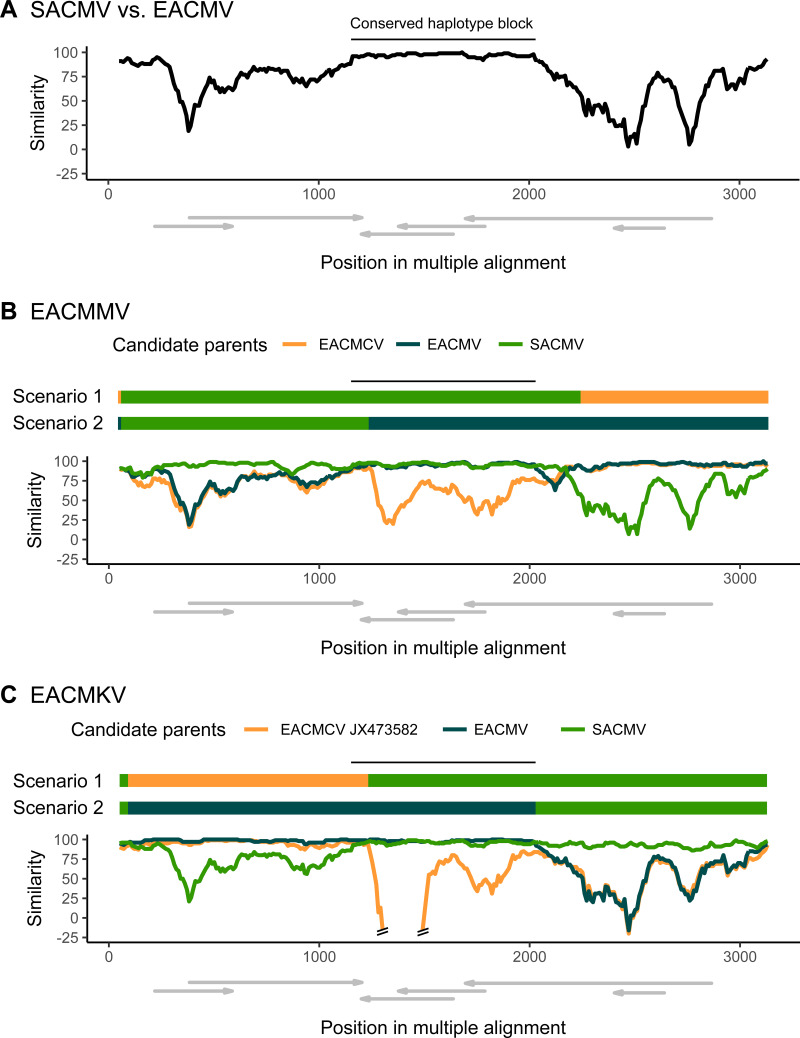
Similarity plots showing similarity between EACMV and SACMV (A) and alternative recombinant origins for the EACMMV (B) and EACMKV (C) DNA-A segments. Plots compare the similarity of 50% consensus sequences of the plotted species (except for panel C, where best candidate EACMCV_JX473582 was used) against a 50% consensus sequence of the query species. The Kimura-2-parameter model of sequence evolution was used to correct distances, and a sliding window size of 100 nt with a step size of 10 nt was used. Above each plot, scenario 1 represents the macroevolutionary events associated with the queried species based on RDP4 results, while scenario 2 represents the plausible alternative recombinant origin. The black line above the schematics depicts the conserved region between EACMV and SACMV sequences, derived from panel A. ORFs with approximate coordinates within the alignment are drawn below each plot.

