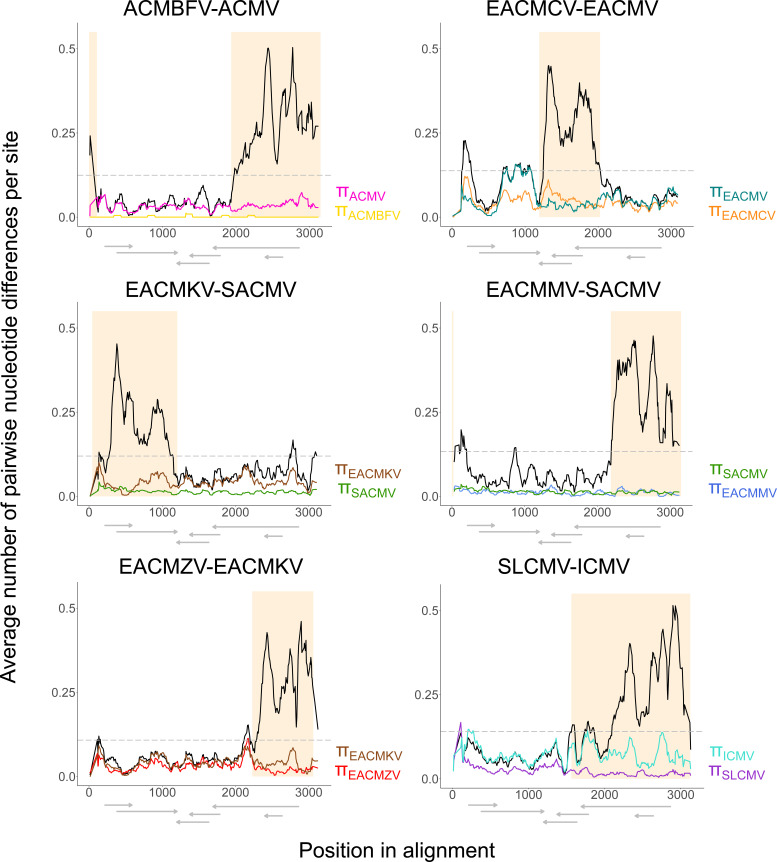
FIG 3.
Sliding window plots of nucleotide diversity (π) and population divergence (DXY) for CMB DNA-A recombinant-major parental clade combinations. DXY between species is plotted in black, and the gray dashed line represents the DXY average between the compared data sets. The shaded area depicts the predicted recombinant fragment based on RDP4 analyses. ORFs with approximate coordinates within the alignment are drawn below each plot.

