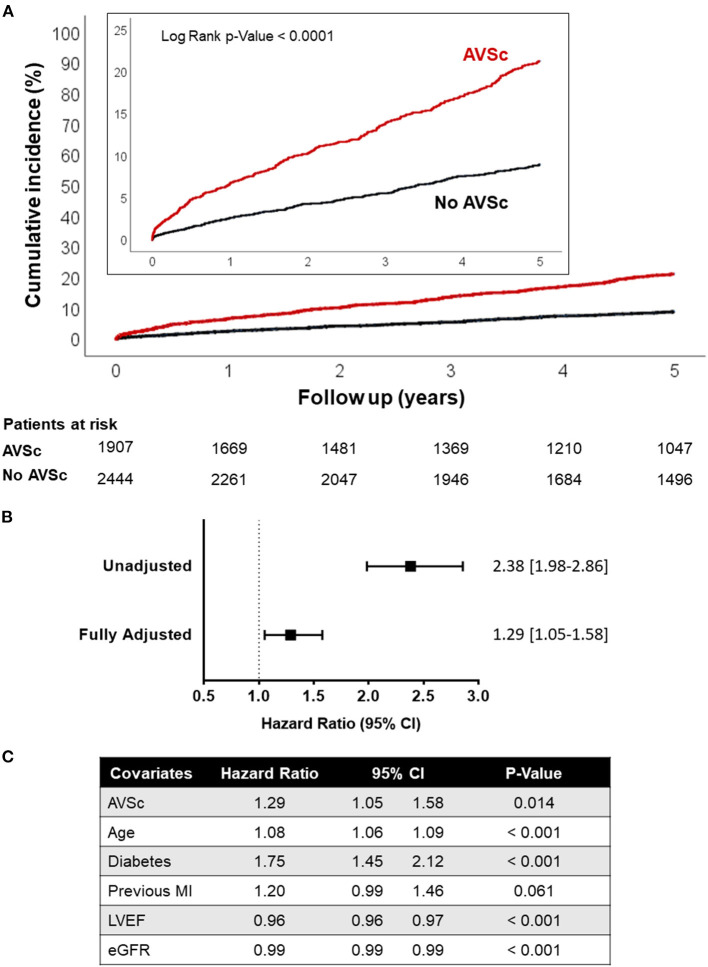
Figure 4.
Long-term all-cause mortality in high-risk CAD patients. (A) Kaplan-Meier curves showing the cumulative incidence of all-cause mortality in high-risk CAD patients with AVSc vs. high-risk CAD patients without AVSc. (B) Cox-regression analyses showing the hazard ratios (HR) unadjusted and fully adjusted for age, diabetes mellitus, previous MI, LVEF, and eGFR. Square brackets indicate the 95% confidence interval. (C) Table showing the HR associated with all covariates considered in the fully adjusted model. AVSc, aortic valve sclerosis; CAD, coronary artery disease; eGFR, estimated glomerular filtration rate; LVEF, left ventricular ejection fraction; MI, myocardial infarction.

