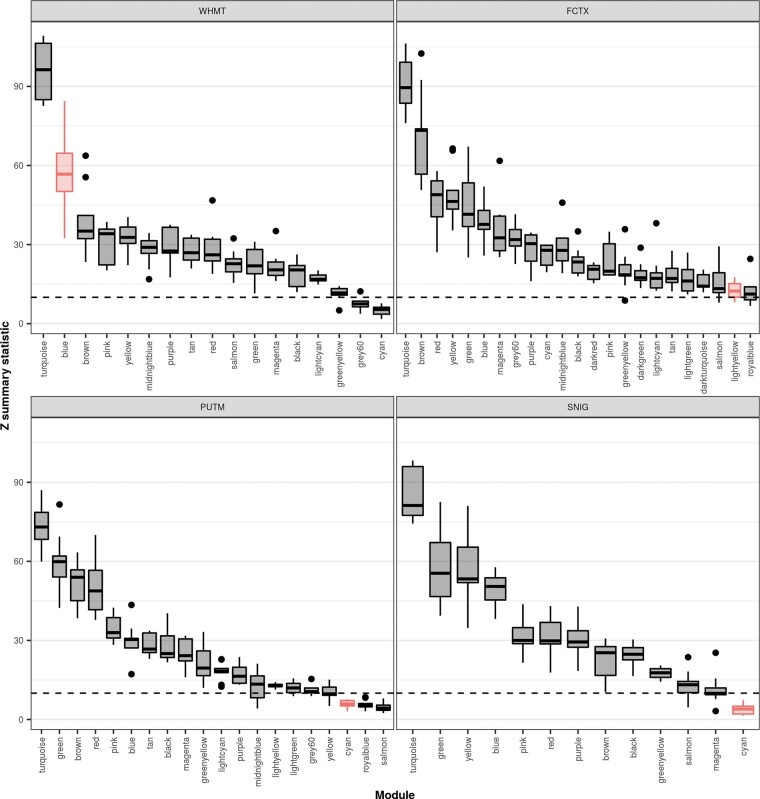
Figure 5.
Module preservation within UKBEC tissues containing dystonia-linked modules. Plot of module preservation for each module within UKBEC tissues containing dystonia-linked modules. Module preservation, as denoted by the Z summary statistic, was determined using a WGCNA-based preservation analysis applied across all 10 UKBEC co-expression networks. Thus, each box plot represents the preservation of the named module within the labelled tissue across the remaining nine tissues. The black dashed lines indicate the threshold for strong evidence of module preservation (Z summary statistic > 10), as defined by Langfelder et al. (2011). Modules enriched with dystonia genes are highlighted in red.

