Figure 1.
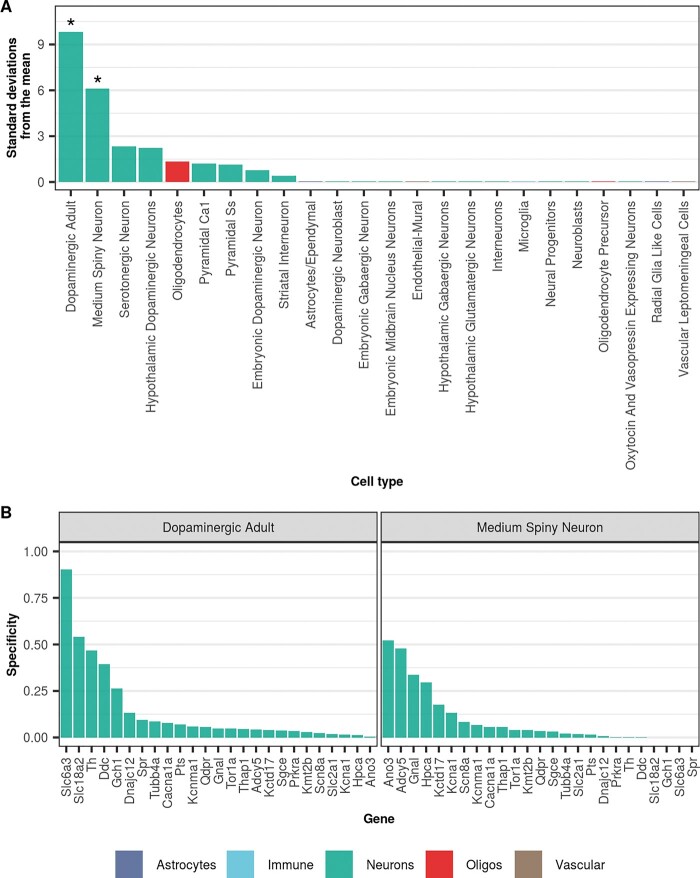
Dystonia-associated genes are highly expressed in dopaminergic neurons and MSNs from mouse. (A) Enrichment of dystonia-associated genes in level 1 cell types from the Karolinska superset was determined using EWCE. Standard deviations from the mean indicate the distance of the mean expression of the target list from the mean expression of the bootstrap replicates. Asterisks denote significance at P < 0.05 after correcting for multiple testing with the Benjamini-Hochberg method over all level 1 cell types. Numerical results are reported in Supplementary Table 1. (B) Plot of specificity values for all dystonia-associated genes within adult nigral dopaminergic neurons and MSNs (level 1 cell types from the Karolinska single-cell RNA-sequencing superset). Specificity values were derived from Skene et al. (2018) who calculated specificity by dividing the mean expression of a gene in one cell type by the mean expression in all cell types. In other words, specificity is the proportion of a gene’s total expression attributable to one cell type, with a value of 0 meaning a gene is not expressed in that cell type and a value of 1 meaning that a gene is only expressed in that cell type. In both plots, cell types are coloured by the overall class they belong to (e.g. astrocyte, neuron, oligodendrocyte, etc.).

