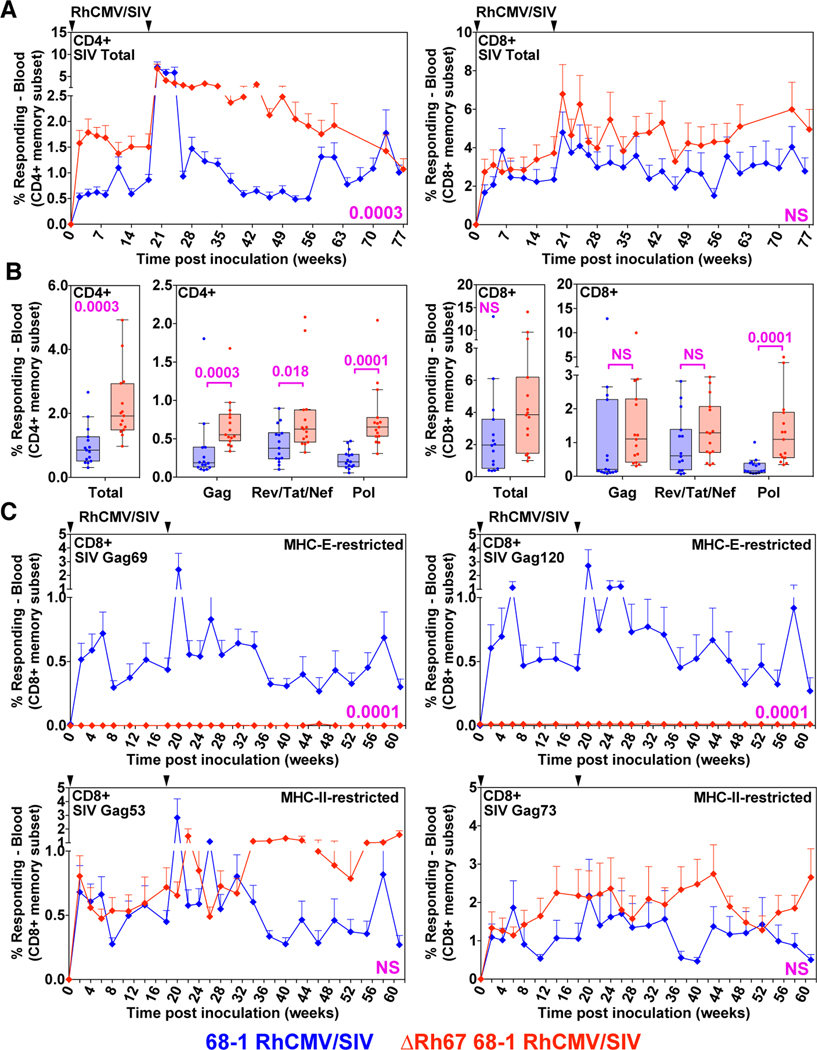
Figure 6. Immunogenicity of ΔRh67 vs. wildtype 68–1 RhCMV/SIV vectors.
(A and B) Longitudinal and plateau-phase analysis of the vaccine-elicited SIVgag-, SIVretanef-, and SIV5’pol-specific CD4+ and CD8+ T cell responses in peripheral blood of RM vaccinated with the ΔRh67 68–1 RhCMV/SIV vector set compared to the Rh67-intact parent 68–1 vector set (see fig. S4). (A) The background-subtracted frequencies of cells producing TNF-α and/or IFN-γ by flow cytometric ICS assay to peptide mixes comprising each of the SIV inserts within the memory CD4+ or CD8+ T cell subsets were summed for overall responses with the figure showing the mean (+ SEM) of these overall responses at each time point. (B) Boxplots compare the total and individual SIV insert-specific CD4+ and CD8 + T cell response frequencies between the two vaccine groups during the vaccine phase plateau. (C) Longitudinal analysis of the vaccine elicited CD8+ T cell responses to SIVgag supertopes in peripheral blood of each vaccine group by ICS assay. Wilcoxon P-values for comparison of all T cell response parameters in panels A to C are shown where significant (p<0.05); adjusted for multiple comparisons in panels B (across individual insert responses) and C (across individual supertopes).

