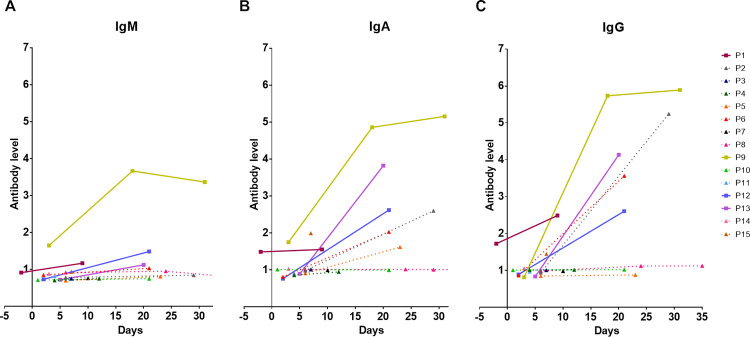
Fig 1. Longitudinal analysis of classes of antibody responses to RBD in COVID-19 patients.
Dynamic changes in RBD-specific IgM (A), IgA (B) and IgG (C) antibody response in individual COVID-19 patients (N = 15). Data are plotted by antibody response calculated as the ratio between OD of uncoated and coated antigen well of an individual sample. Each line represents an individual subject. Solid line and square symbol represent pneumonia cases. Dot line and triangle symbol represent mild cases.

