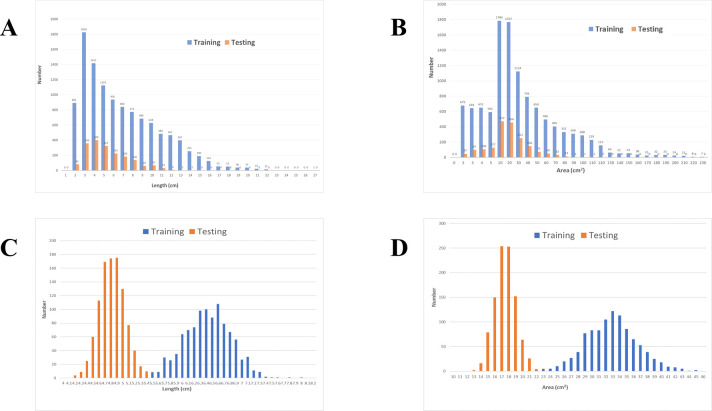
Fig 1.
(A) Distribution of LDs of Abnormal Liver Density. (B) Distribution of areas of abnormal liver density. (C) Distribution of LDs after bootstrap resampling with a mean value of 100 samples repeated 1,000 times (r = 0.9980, p < 0.0001). (D) Distribution of areas after bootstrap resampling with a mean value of 100 samples repeated 1,000 times (r = 0.9988, p < 0.0001).

