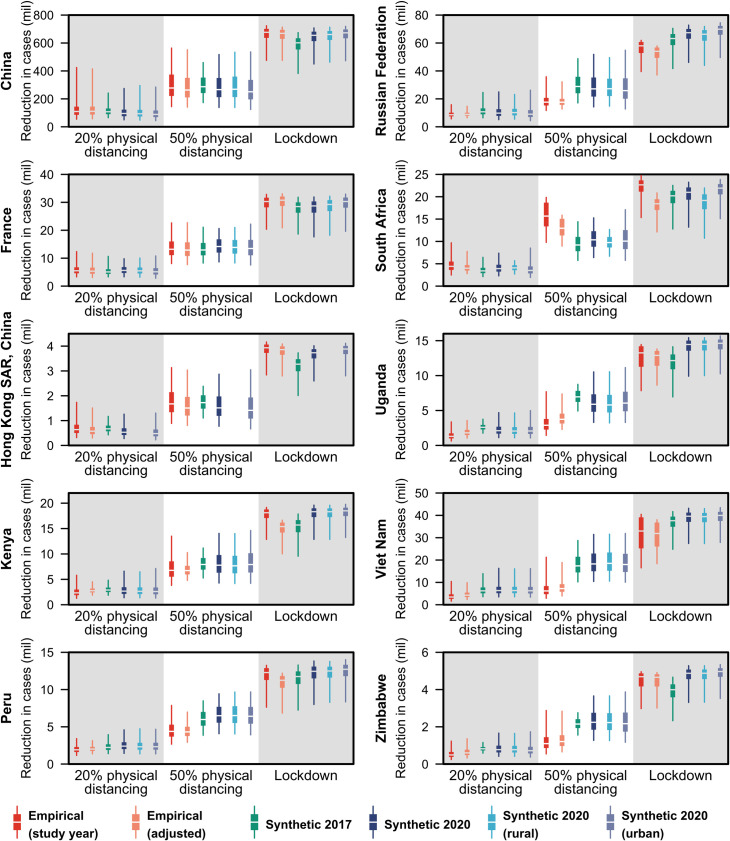
Fig 5. Reduction in cases due to interventions in models of COVID-19 epidemics under three intervention scenarios in ten geographical regions using the empirical and synthetic matrices.
The reduction in cases in each of the three intervention scenario—20% physical distancing, 50% physical distancing, and lockdown—against the unmitigated epidemic under different contact matrices is shown in the boxplots with boxes bounded by the interquartile range (25th and 75th percentiles), median in white and, whiskers spanning the 2.5–97.5th percentiles. Six contact matrices were considered in the COVID-19 modelling: the empirically-constructed contact matrices at the study-year and adjusted for the 2020 population, the 2017 synthetic matrices, and the updated synthetic matrices at the national, rural, or urban settings.

