
Fig 6. Estimated dispersal kernel for the sharka epidemic.
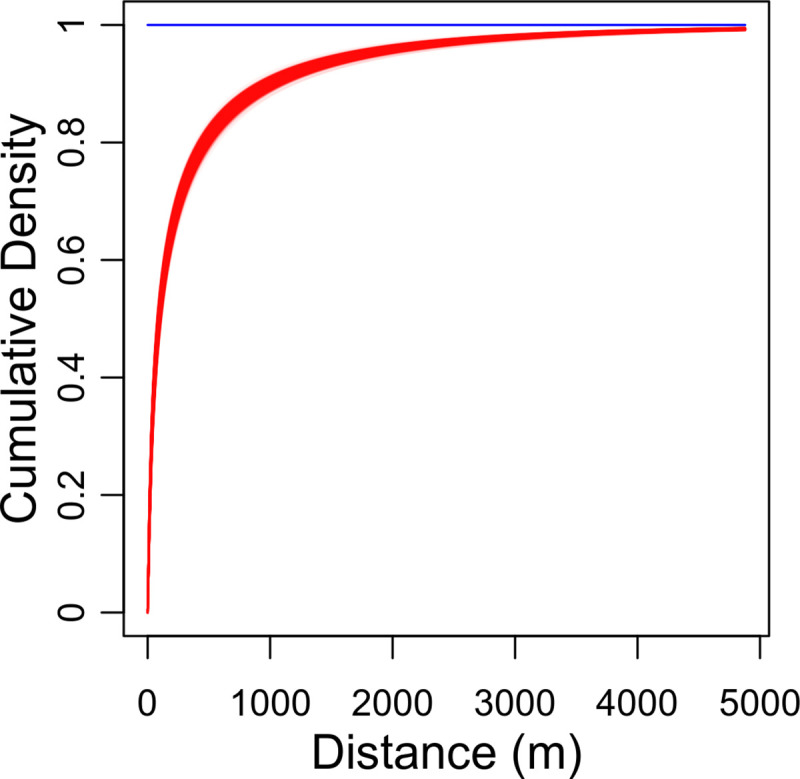
The posterior marginal cumulative distribution function, F1D, of the fitted dispersal kernel, obtained for κ = 11 (i.e. the number of introduction patches maximising the Fisher information). The plotted posterior distribution was obtained from 4000 MCMC samples. One line is plotted per sample.