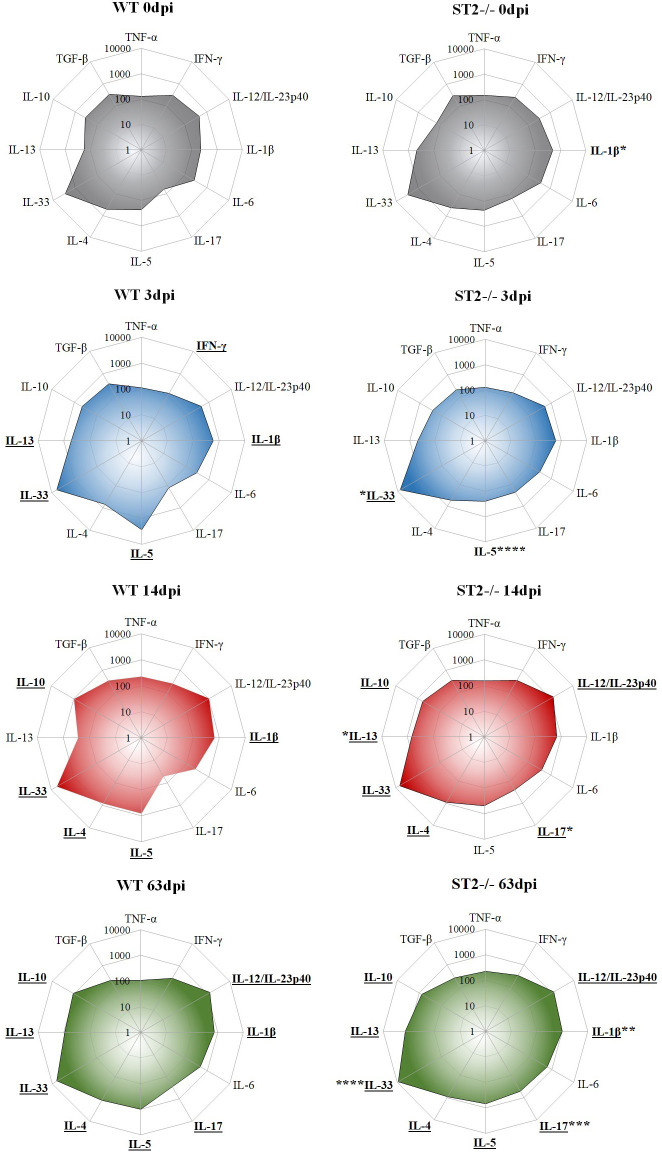
Fig 4. Profile of cytokines present in lung tissue during infection with T. canis.
Radar graphs express the concentration of pulmonary cytokines throughout the infection. The results represent the mean ± S.E.M., *p<0.05, **p<0.01, ***p<0.001, ****p<0.0001 when compared to the corresponding WT groups. Cytokines were underlined when they had statistical difference with their respective control group (0dpi). One-way ANOVA test and the Kruskal-Wallis test followed by the Dunn test were used.

