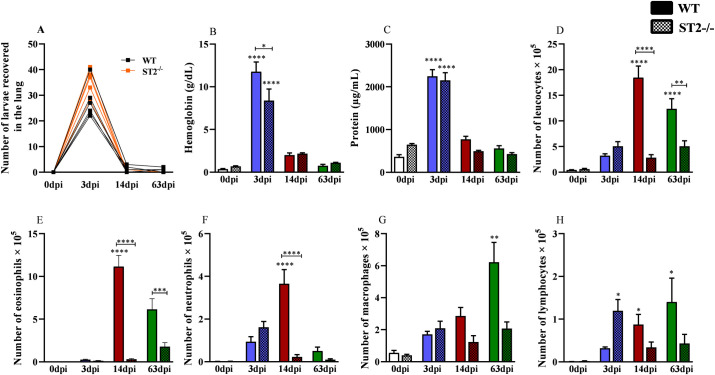
Fig 5. Quantification of recovered larvae in the lungs and inflammation in the airways.
(A) Number of larvae recovered from the lung; (B) Hemoglobin quantification in the bronchoalveolar lavage (BAL); (C) Total protein levels in BAL; (D) Quantification of total leukocytes infiltration in BAL; (E) Number of eosinophils in BAL; (F) Number of neutrophils in BAL; (G) Number of macrophages in BAL; (H) Number of lymphocytes in BAL. Statistical comparisons were made between each strain with its specific uninfected group (0dpi) represented by the asterisk without the bar and between strains at the same time of infection represented by the asterisk with the bar. Results represent mean ± S.E.M., *p<0.05, **p<0.01, ***p<0.001, ****p<0.0001. One-way ANOVA test and Kruskal-Wallis test followed by Dunn’s test were used.

