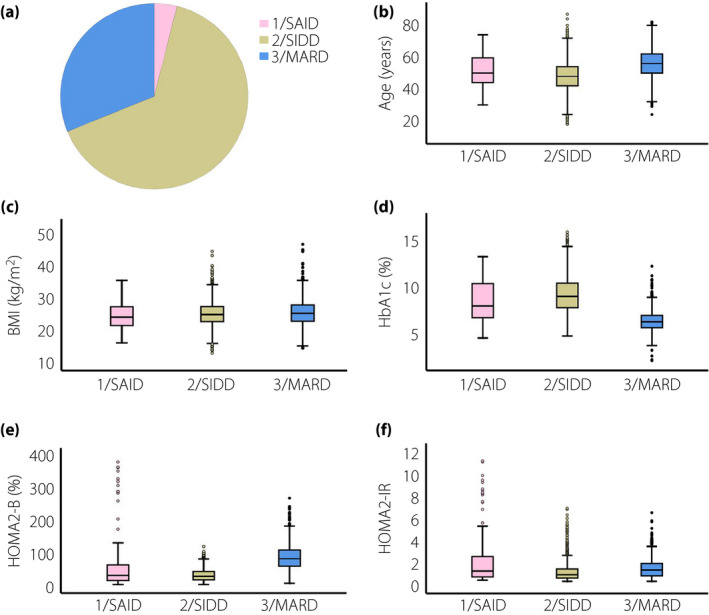
Figure 2.

Participant distributions and characteristics in Chinese women with type 2 diabetes according to the European classification. (a) Distributions of Chinese women (n = 2327) according to the two‐step cluster analysis. (b) Distributions of age at diagnosis for each cluster. (c) Distributions of body mass index (BMI) for each cluster. (d) Distributions of glycated hemoglobin (HbA1c) for each cluster. (e) Distributions of homeostatic model assessment 2 to estimate β‐cell function (HOMA2‐B) for each cluster. (f) Distributions of homeostatic model assessment 2 to estimate insulin resistance (HOMA2‐IR) for each cluster.
