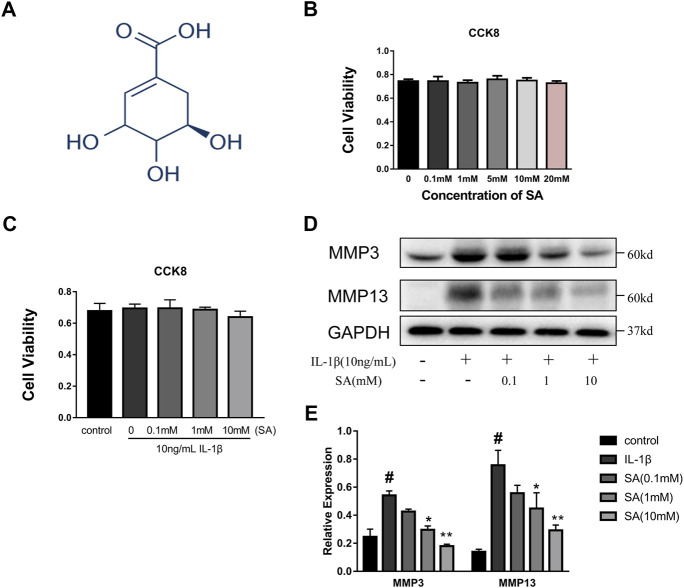
FIGURE 1.
SA has no impaired effect on cellular viability and 10 mM concentration is utilized in subsequent experiments. (A) Chemical structure of SA; (B) SW1353 cells were exposed to increasing concentrations of SA (0, 0.1, 1, 5, 10, and 20 mM), and cell viability was determined by CCK-8 assay. The data are shown as the mean ± SD (n = 5); (C) SW1353 cells were exposed to 10 ng/ml with or without SA, and cell viability was determined by the CCK-8 assay. The data are shown as the mean ± SD (n = 5). (D, E) Representative western blots and quantification data showing the MMP3 and MMP13 expression in the SW1353 cells of each group. The data are shown as the mean ± SD (n = 3). Significant differences between groups are indicated as follows: # p < 0.05 vs. the control group; *p < 0.05 and **p < 0.01 vs. the IL-1β group.

