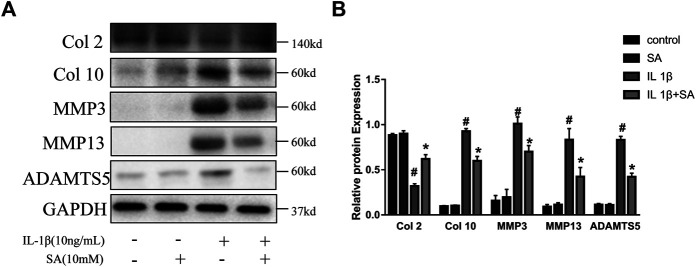
FIGURE 3.
SA attenuates IL-1β-stimulated anabolic and catabolic dysregulation in SW1353 cells. Representative western blots and quantification data showing the Col 2, Col 10, MMP3, MMP13, and ADAMTS5 expression in cells treated as described above. The data are shown as the mean ± SD (n = 3). # p < 0.05 vs. the control group; *p < 0.05 vs. the IL-1β group.

