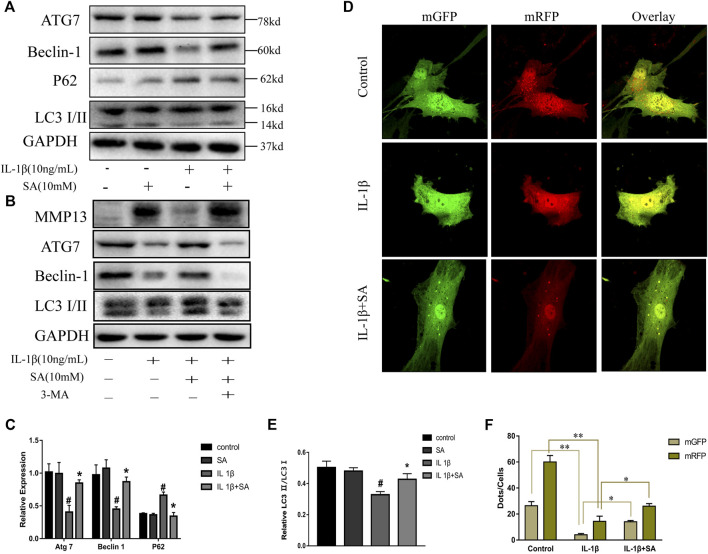
FIGURE 4.
SA ameliorates IL-1β-induced impairment of autophagy in SW1353 cells. (A,C,E) Representative western blots and quantification data showing ATG7, Beclin-1, P62 and LC3 expression in cells treated as described above. The data are shown as the mean ± SD (n = 3). # p < 0.05 vs. the control group; **p < 0.01 vs. the IL-1β group. (B) Western blot showing the MMP13, ATG7, Beclin-1, and LC3 expression in cells treated as described above. (D,F) Fluorescence microscopy analysis of chondrocytes transfected in each group with mRFP-GFP-LC3-carrying adenovirus. The data are shown as the mean ± SD (n = 3). Significant differences between groups are indicated as **p < 0.01, *p < 0.05.

