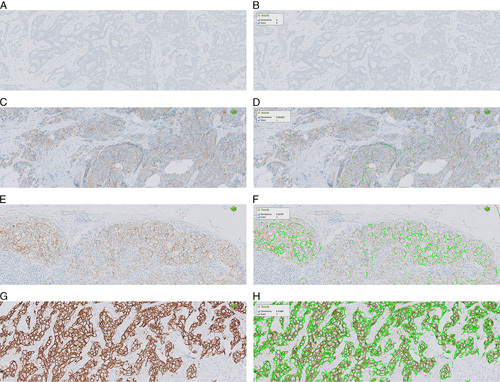
FIGURE 1.

Example of HER2-CONNECT (Visiopharm) quantitative image analysis in breast carcinoma. The left panel of images (A, C, E, G) shows IHC staining and the right panel (B, D, F, H) shows HER2 membrane connectivity (green color line) detected by the algorithm. HER2 IHC 0 (A, B); HER2 IHC 1+ (C, D); HER2 IHC 2+ (E, F); HER2 IHC 3+ (G, H). HER2 indicates human epidermal growth factor receptor 2; IHC, immunohistochemistry.
