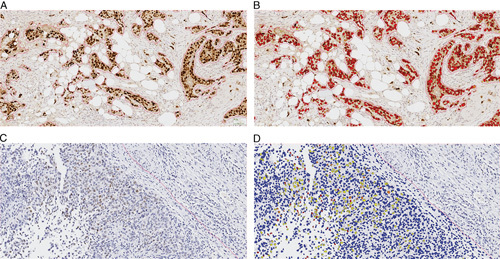
FIGURE 2.

Example of estrogen receptor quantification (Visiopharm). Representative images from 2 cases with strong (A, B) (H-score: 275) and weak (C, D) (H-score: 21) estrogen receptor staining. A and C, Original IHC images. B and D, Analyzed images with pseudo-colors. Brown: Original IHC color; blue: original nuclear counterstain; red: strong staining intensity; yellow: weak staining intensity. IHC indicates immunohistochemistry.
