FIGURE 4.

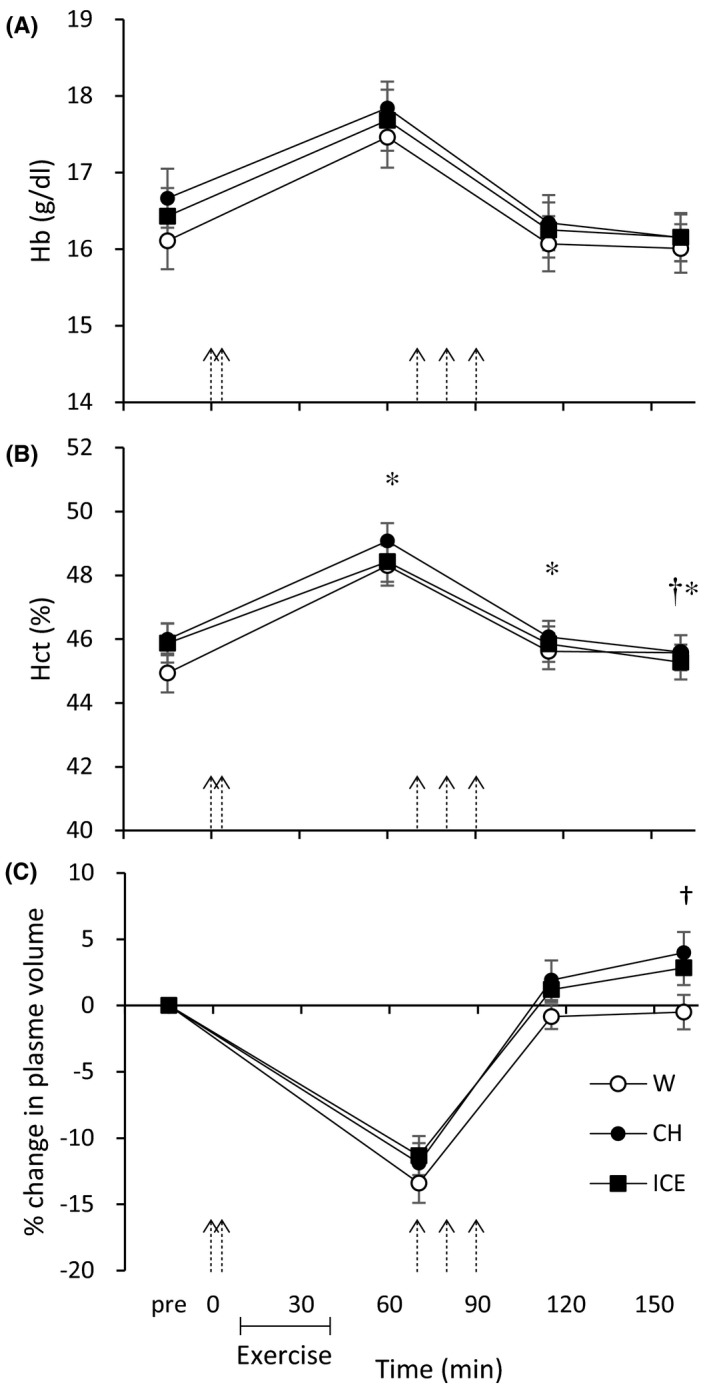
Hb (A), Hct (B), and relative change in plasma volume (%ΔPV; C) during the experiment for W, CH, and ICE conditions (means ± standard error of the mean). Arrows denote when the drink was ingested. † P < .05 (W vs CH), *P < .05 (W vs ICE)

Hb (A), Hct (B), and relative change in plasma volume (%ΔPV; C) during the experiment for W, CH, and ICE conditions (means ± standard error of the mean). Arrows denote when the drink was ingested. † P < .05 (W vs CH), *P < .05 (W vs ICE)