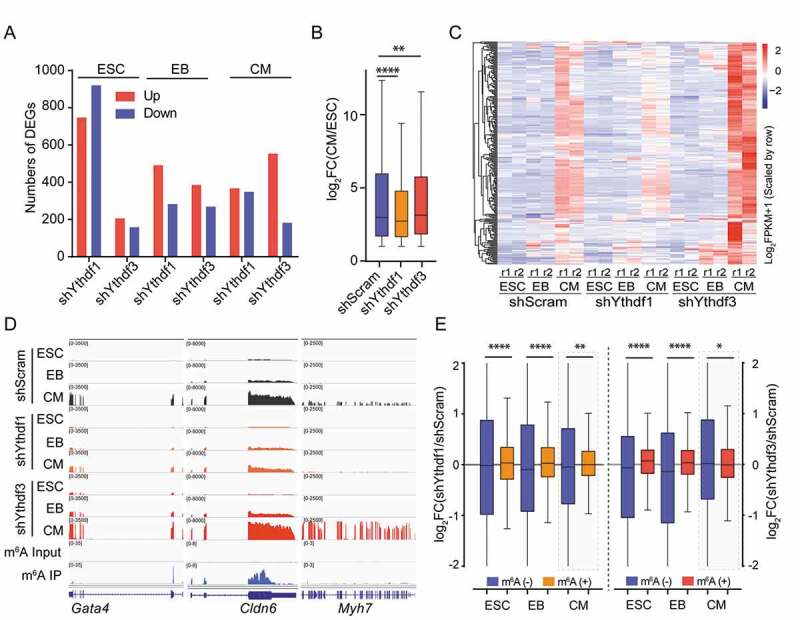
Figure 5.

YTHDF1 and YTHDF3 conversely regulate the expression of cardiac genes
(A) Number of differentially expressed genes captured in Ythdf-knockdown and shScram cells at day 0 (ESC), day 2 (EB) and day 8 (CM). (B) Box plot showing the fold changes (CM/ESC) of RNA-seq FPKM in upregulated genes (fold change > 2) upon differentiation in shScram and Ythdf-depleted cells. Two-tailed Mann-Whitney test, P **<0.01, P ****<0.0001, n = 2. (C) Heat map showing RNA-seq FPKM of CM-specific genes in shScram and Ythdf-knockdown cells at indicated differentiation stages (n = 238). (D) Genome browser view of representative genes showing RNA-seq and m6A-seq read density in shScram and Ythdf-knockdown cells. (E) Box plot showing m6A-containg RNAs bearing significantly increased abundance upon depletion of YTHDF1 or YTHDF3 in ESC and EB rather than CM. Two-tailed Mann-Whitney test, P *<0.05, P **<0.01, P ****<0.0001, n = 2.
