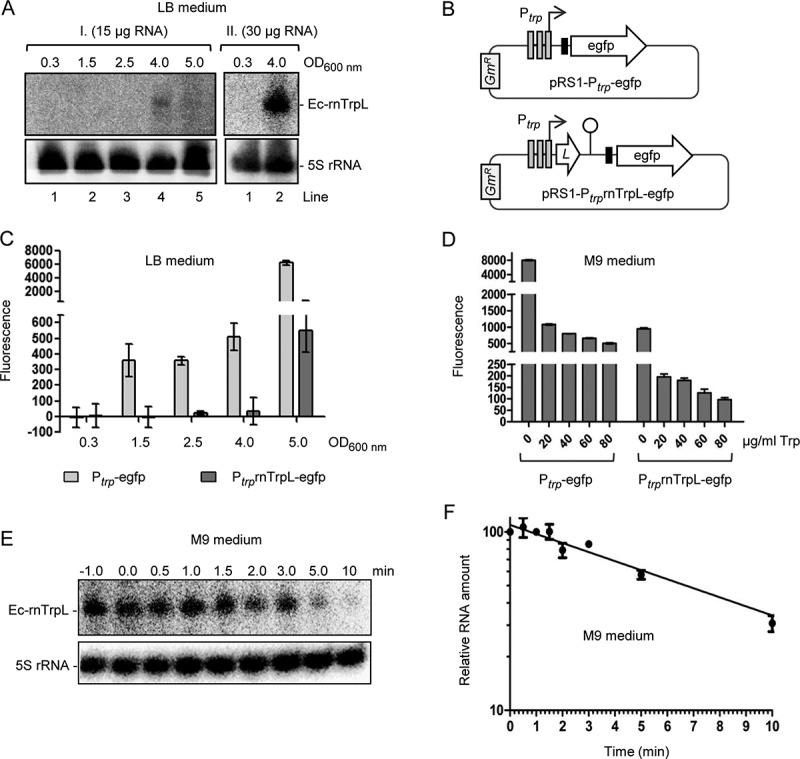
Figure 2.

Analysis of Ec-rnTrpL in rich and minimal media. (A) Northern blot analysis of Ec-rnTrpL in total RNA from cells cultivated in LB to the indicated ODs. Results of two independent experiments (I. and II.) are shown. The loaded RNA amount is given. After hybridization with an Ec-rnTrpL specific probe, the membrane was rehybridized with a probe detecting 5S rRNA (loading control). Detected RNAs are indicated on the right. (B) Schematic representation of the plasmids, which contain egfp reporter fusions and were used to analyse the impact of transcription and attenuation on the trp operon expression. The Shine-Dalgarno sequence upstream of egfp is indicated by a black, small rectangle. GmR, gentamycin resistance. For other details, see Fig. 1A. (C) Fluorescence of cultures harbouring the indicated constructs, which were cultivated in LB medium to the indicated ODs. Normalization to the EVC was performed. (D) Fluorescence of cultures harbouring the indicated constructs, which were cultivated in M9 medium supplemented with Trp (the Trp concentrations are given). (E) Northern blot analysis for determination of the half-life of Ec-rnTrpL in M9 medium without Trp addition. The time after addition of rifampicin is indicated above the panel (in min). Detected RNAs are indicated on the left. A representative blot is shown. For other details see panel (A). For size markers, see Fig. S1. (F) Graphical representation of the results from (E) and an additional, independent experiment. Shown are mean values and standard deviations. The standard deviations at the time points 1 min and 3 min are smaller than the symbol
