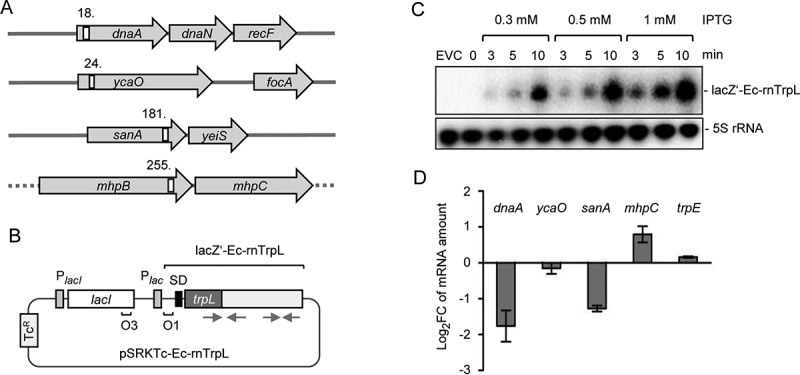
Figure 4.

Induced Ec-rnTrpL overproduction affects the levels of three predicted target mRNAs. (A) Schematic representation of the localization of the putative interaction sites of Ec-rnTrpL in the analysed, predicted targets. Annotated genes are indicated by grey arrows and the putative interaction sites by white rectangles. The numbers indicate the codon at which the predicted interaction starts (see also Fig. 6A and Fig. S3). The grey horizontal line indicates chromosomal DNA; the dashed line indicates that mhpB and mhpC are part of a larger operon harbouring upstream and downstream genes. (B) Schematic representation of the tetracycline-resistance (TcR) plasmid used for IPTG-inducible production of lacZ′-Ec-rnTrpL. The promoter of the repressor gene lacI and the lac promoter are indicated by grey rectangles, the lacZ Shine-Dalgarno sequence by a black rectangle, the operators O1 and O3 are also indicated. The cloned Ec-rnTrpL sequence starts with ATG of trpL and ends with the transcription terminator (positions 27–140, see Fig. 1B). The grey arrows indicate the sRNA regions that base pair to form the anti-antiterminator and the terminator stem-loops (compare to Fig. 1). (C) Northern blot analysis of induced lacZ′-Ec-rnTrpL production in LB medium. Used IPTG concentrations and the induction time are indicated. EVC, empty vector control. After hybridization with an Ec-rnTrpL specific probe, the membrane was rehybridized with a probe detecting 5S rRNA (loading control). A representative blot is shown. (D) Analysis by qRT-PCR of changes in the levels of the indicated mRNAs upon Ec-rnTrpL induction in LB medium. The levels at 3 min after IPTG addition were compared to the levels before addition of IPTG (0 min). A control experiment with the EVC revealed no decrease in the mRNA levels of dnaA and sanA (Fig. S4). The rpoB gene was used as a reference. Shown are means and standard deviations from three independent experiments
