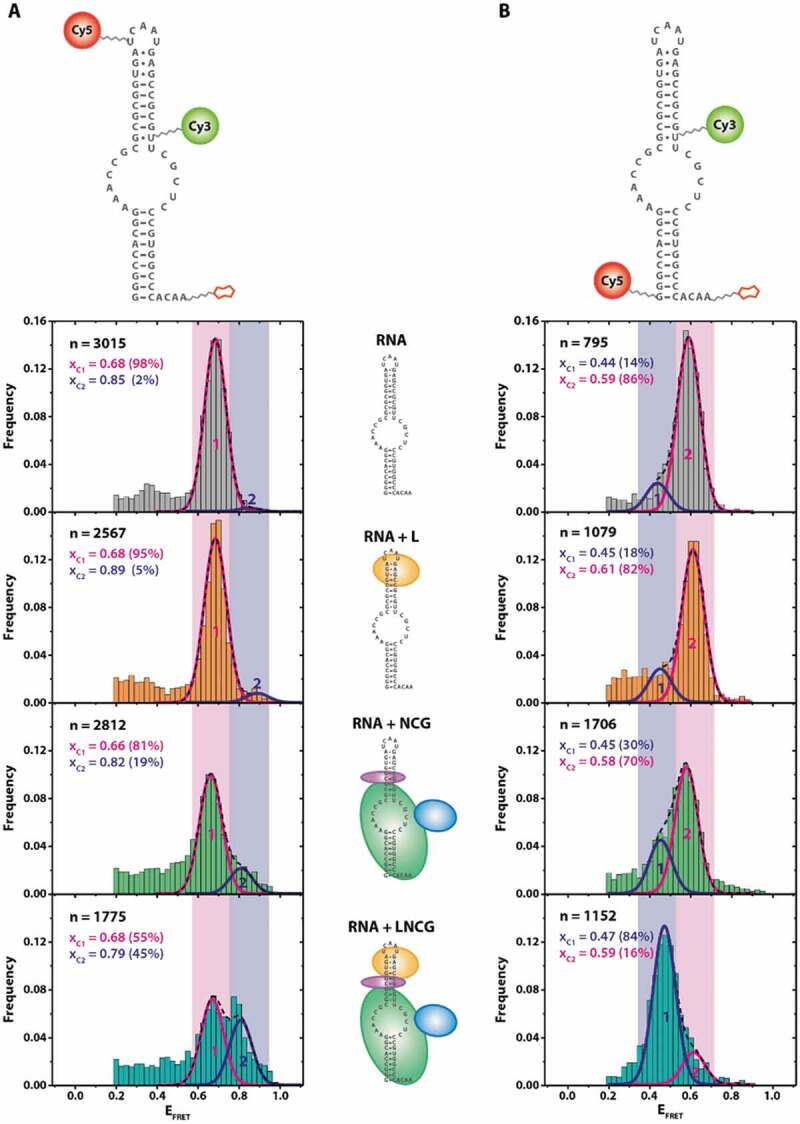
Figure 2.

FRET populations in RNP reconstitution experiments show RNA distortion upon protein binding. (A) FRET construct used for assessing the conformation of the upper stem-loop structure of the sRNA. Stepwise assembly is indicated for each FRET histogram. (B) FRET construct used for assessing conformation of the pseudouridylation pocket. Complex composition: RNA + proteins L7Ae (“L), Nop10 (“N), Cbf5 (“C), Gar1 (‘G’). n = number of molecules analysed. Xci = centre of FRET distributions. The histograms were cropped for donor-only molecules at EFRET<0.2 (see Material and Methods)
