Figure 3.

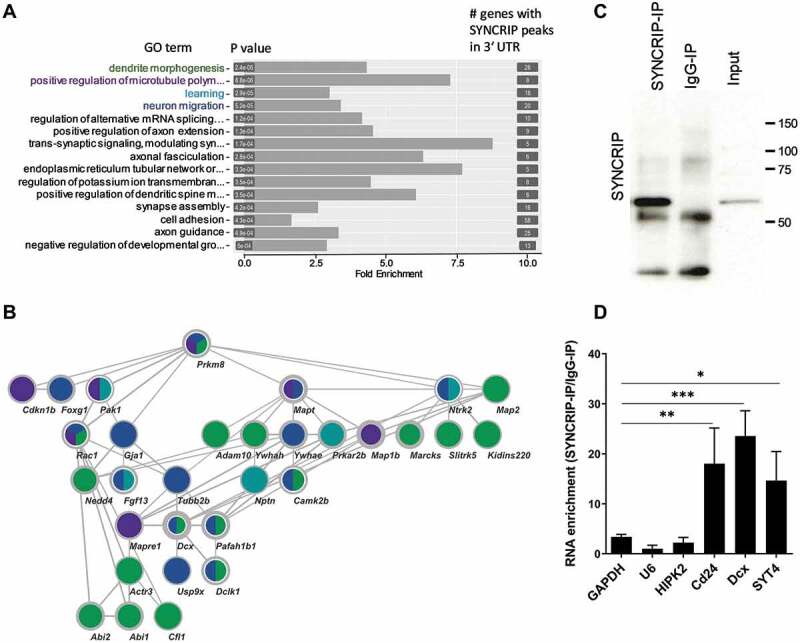
GO and Network analysis of SYNCRIP iCLIP targets. (A). Gene ontology (GO) analysis of biological process (BP) terms enriched in SYNCRIP iCLIP target genes. Top 15 BP terms based on statistical enrichment (P-values) are indicated. The number of genes in each term is indicated on the right. (B). STRING network interaction analysis of SYNCRIP iCLIP target genes of the top four BP-GO terms (in green: dendrite morphogenesis, in violet: positive regulation of microtubules, in turquoise: learning and in blue: neuronal migration). Thickness of lines: STRING confidence of interaction; thickness of node borders (light grey): log2 iCLIP peaks. (C). Western blot of SYNCRIP- and IgG-RNA-IPs using anti-SYNCRIP-antibody. (D). qPCR of selected SYNCRIP iCLIP target mRNAs after RNA-IP (as in C). The RNA enrichment scores for each gene are calculated by dividing the relative RNA amounts recovered from the SYNCRIP-IP to those from the IgG IP. GAPDH, U6 and HIPK2 were not enriched in SYNCRIP iCLIP and therefore served as negative controls. Data are presented as mean ± SD (n = 3 independent IP experiments). Statistical test is performed using one-way ANOVA (F (6,14) = 13.81; P < 0.0001; Dunnett’s multiple comparisons test: adj. p-value, * < 0.05, ** < 0.01, *** <0.001)
