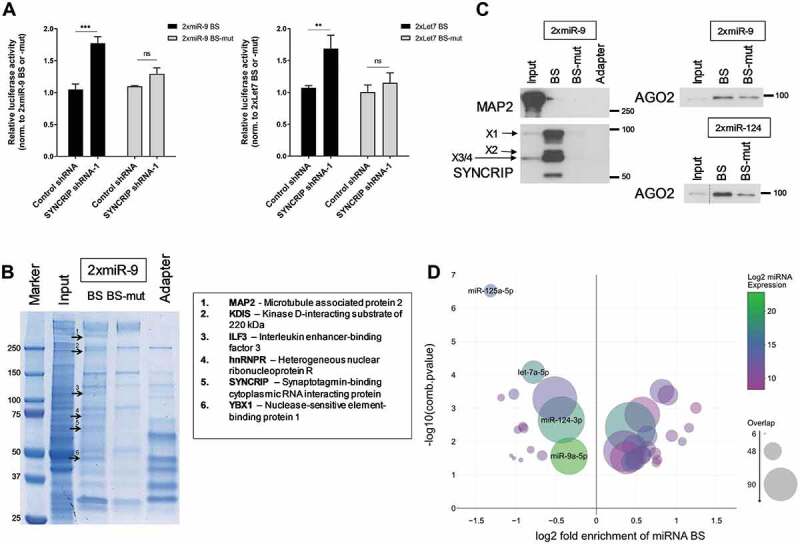
Figure 5.

SYNCRIP promotes miRNA-dependent repression. (A). Luciferase reporter gene assays in rat cortical neurons (DIV 6–9) transfected with the indicated 2xmiR binding site (BS) reporters (either wt (dark) or mutant (grey)) and shRNA constructs. Relative luciferase activity (firefly/renilla activity) is presented as mean ± SD (n = 3). For each reporter gene, results from co-transfection of a vector alone (without shRNA) were set to one. Statistical test is performed using two-way ANOVA. 2x miR-9 (2x miR-9 BS: P < 0.0001, 2x miR-9 BS-mut: P = n.s.; BS: F (1,8) = 96.05, P < 0.0001; shRNA: F (1,8) = 21.03, P = 0.0018; BS x shRNA: F (1,8) = 32.01, P = 0.0005), 2x Let7 (2x Let7 BS: P < 0.01, 2x Let7 BS-mut: P = n.s.; BS: F [1,8] = 21.08, P = 0.0018; shRNA: F (1,8) = 13.31, P = 0.0065; BS x shRNA: F (1,8) = 8.046, P = 0.0219). (B). Colloidal blue stained SDS-PAGE gel depicting proteins (bands) that have been pulled down from cortical neuron extracts using either in vitro transcribed 2x miR-9 BS RNA oligonucleotides or adapter only. Six proteins that were identified by mass spectrometry analysis in at least two independent pull-down experiments are indicated, together with their migration position in SDS-PAGE. (C). Western blot using the indicated antibodies with 2xmiR-9 and 2xmiR-124 pull-downs from cortical neuron extracts (as in 5B). (D). miRNA binding site enrichment analyses on SYNCRIP iCLIP target genes. Circle sizes indicate the number of SYNCRIP target genes, which contain binding sites of the specific indicated miRNA (overlap). A combined -log10 transformed p-value (lower number of a hypergeometric test for enrichment or depletion of miRNA binding sites) is displayed on the y-axis, the x-axis shows log2 fold enrichment of miRNA binding sites against the background. miRNA expression levels in DIV7 cortical neuronal cultures [21] are colour-coded. Only miRNAs with a p-value ≤ 0.05 and an overlap > 5 are plotted. Pro-neural miRNAs miR-125a-5p, miR-124-3p, miR-9a-5p and let7a-5p are highlighted
