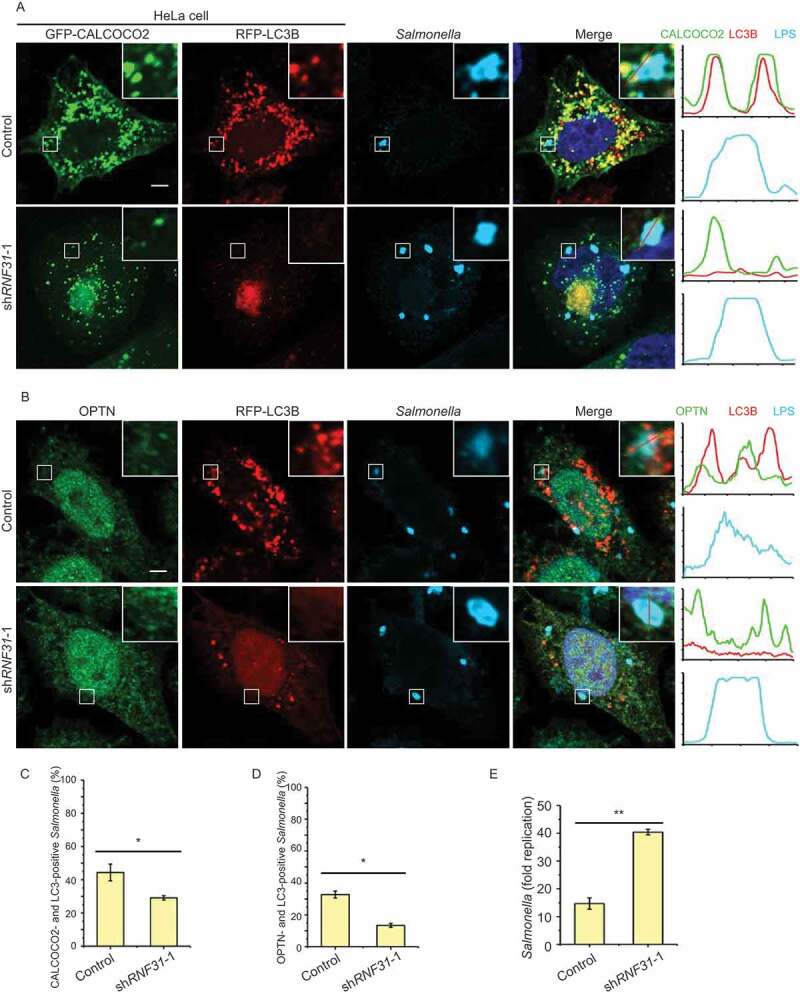
Figure 7.

RNF31 knockdown inhibits xenophagy initiation and promotes cell death. (A) Confocal image of CALCOCO2, LC3B and infected S. Typhimurium colocalization in HeLa cells. Cell were transfected with GFP-CALCOCO2, RFP-LC3B, along with control shRNA or RNF31 shRNA-1. Cells were fixed at 3 h post-infection and stained for LPS (S. Typhimurium). Representative fluorescence images are shown. Line graphs show fluorescence plots along indicated lines. Scale bar: 5 μm. (B) Confocal image of OPTN, LC3B and infected S. Typhimurium colocalization in HeLa cells. Experimental procedures were the same as that in (A) except cells were transfected with RFP-LC3B along with the control shRNA or RNF31 shRNA-1 and cells were stained for endogenous OPTN and LPS (S. Typhimurium). Scale bar: 5 μm. (C and D) Percentage of CALCOCO2- and LC3B-positive S. Typhimurium as represented in (A). Percentage of OPTN- and LC3B-positive S. Typhimurium as represented in (B). At least 80 bacteria per cover slide were counted. Data are mean ± SD, n = 5 images (1 cover slide from three independent experiments). *p < 0.05 (Student’s t-test). (E) Fold replication of S. Typhimurium in the control and RNF31 shRNA-1 knockdown cells. Bacteria were counted based on the colony-forming unit assay. Data are depicted as fold replication of S. Typhimurium at 8 h versus 2 h post-infection (mean ± SD; n = 3). **p < 0.01 (Student’s t-test)
