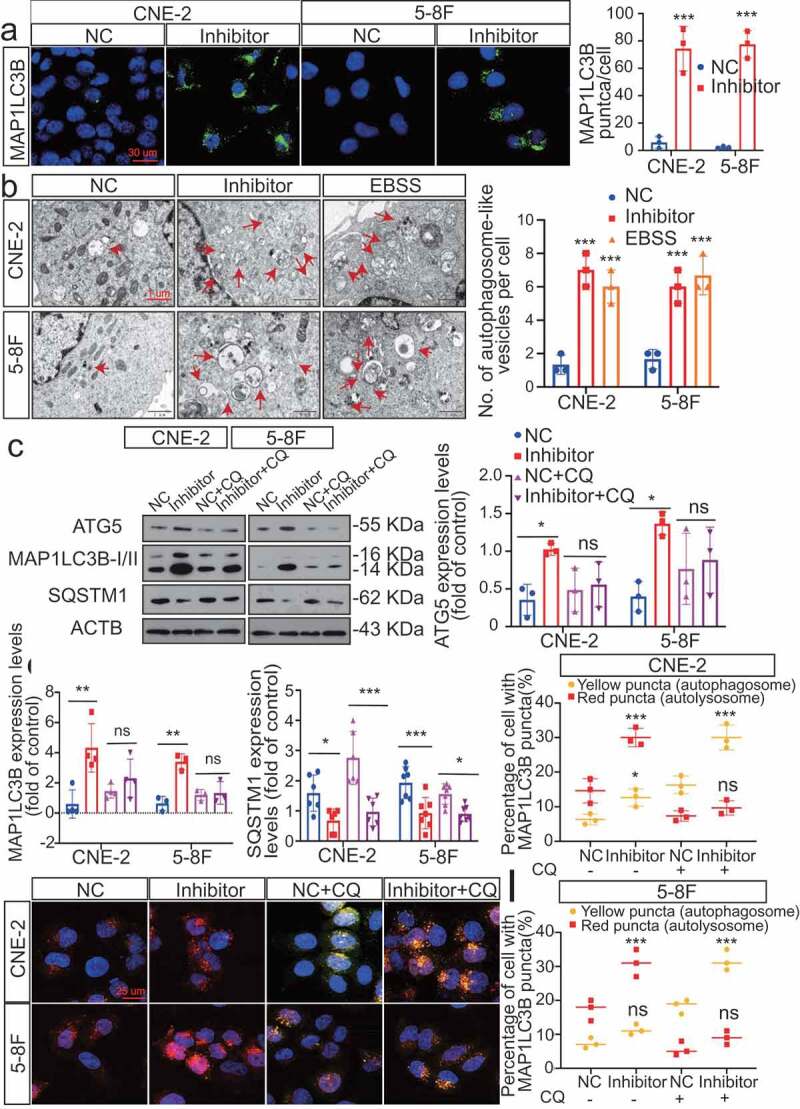
Figure 3.

Silencing of MIR106A-5p promotes autophagy in NPC cells. (A) Left, immunofluorescence analysis of endogenous MAP1LC3B puncta in cells transfected with MIR106A-5p inhibitor or control. Right, total number of endogenous MAP1LC3B puncta per cell. Student’s t-test. (B) Left, transmission electron microscopy analysis of autophagy. Arrows indicate cell autophagosomes/autolysosomes. Right, quantification of the total autophagosome numbers per cell analyzed using Student’s t-tests. EBSS: Earle’s balanced salt solution. (C) Western blot (WB) analysis of changes in MAP1LC3B conversion, ATG5, and SQSTM1 levels induced by MIR106A-5p silencing in NPC cells in the absence (–) or presence (+) of 10 μmol/L chloroquine (CQ) treatment. ACTB was used as a loading control. (D-F) quantification of WB results from three independent experiments. (G-I) Cells were transiently transfected with mRFP-GFP-MAP1LC3B reporter, which differentiates between autophagosomes (GFP+ RFP+, yellow puncta) and autolysosomes (GFP− RFP+, red puncta). Cells were transfected with MIR106A-5p inhibitor in the absence or presence of CQ to inhibit autophagosome and lysosome fusion. Results were analyzed using two-way ANOVA with at least three independent replicates per condition. All experiments were repeated three times with similar results. Images in A–I are representative of three independent experiments. Data represent mean ± SEM. Unprocessed original scans of three independent blots are shown in Fig. S9
