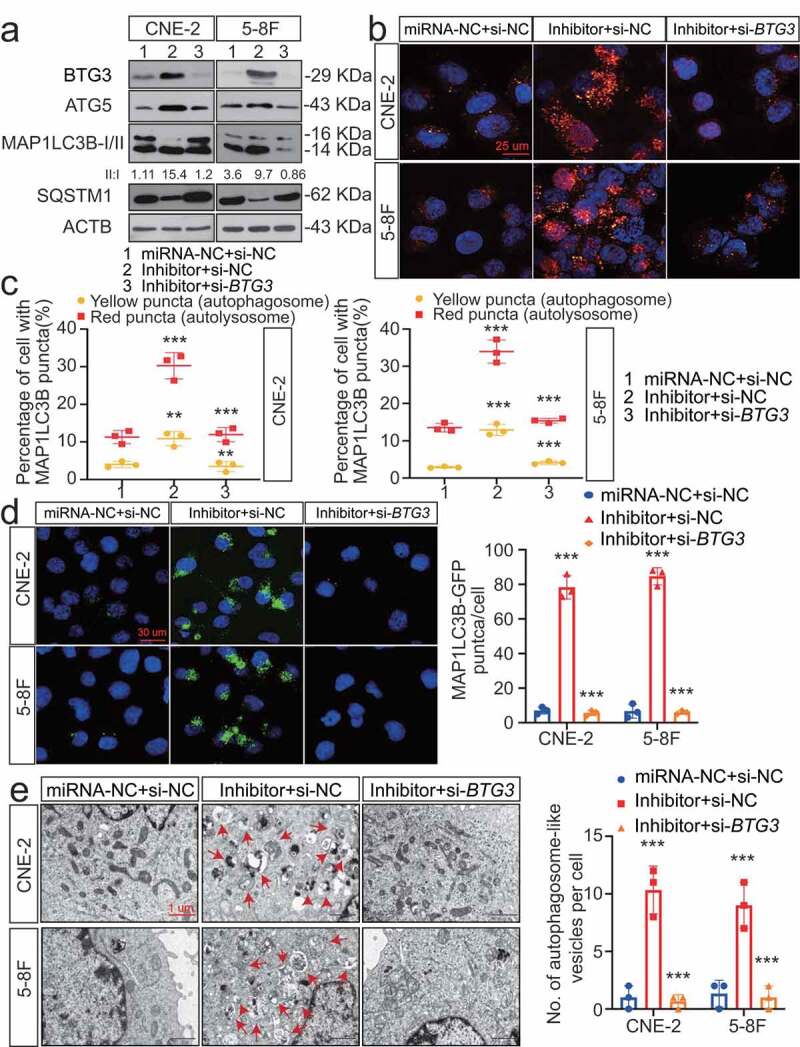
Figure 6.

The MIR106A-5p-BTG3 axis regulates NPC cell autophagy. (A) Expression of MAP1LC3B conversion, ATG5, and SQSTM1 was measured by WB in MIR106A-5p-silenced NPC cells transfected with BTG3-specific siRNA or control. (B) Detection of autophagic flux with the mRFP-GFP-LC3 reporter in MIR106A-5p-silenced NPC cells transfected with BTG3-specific siRNA or control. Scale bar: 25 μm. (C) Analysis of autophagic flux using two-way ANOVA with at least three independent replicates per condition (**P < 0.01, ***P < 0.001). (D) Left, immunofluorescence analysis of endogenous MAP1LC3B puncta in cells. Scale bar: 30 μm. Right, total number of endogenous MAP1LC3B puncta per cell analyzed using two-way ANOVA with at least three independent replicates per condition (***P < 0.001). (E) Left, transmission electron microscopy analysis of autophagy. Arrows, autophagosomes/autolysosomes. Scale bar: 1 μm. Right, the total numbers of autophagosomes per cell were quantified and analyzed using two-way ANOVA with at least three independent replicates per condition (***P < 0.001). Experiments were conducted with at least three independent replicates. All experiments were repeated three times with similar results. Images in A-B and D-E are representative of three independent experiments. Data represent mean ± SEM. Unprocessed original scans of three independent blots are shown in Fig. S9
