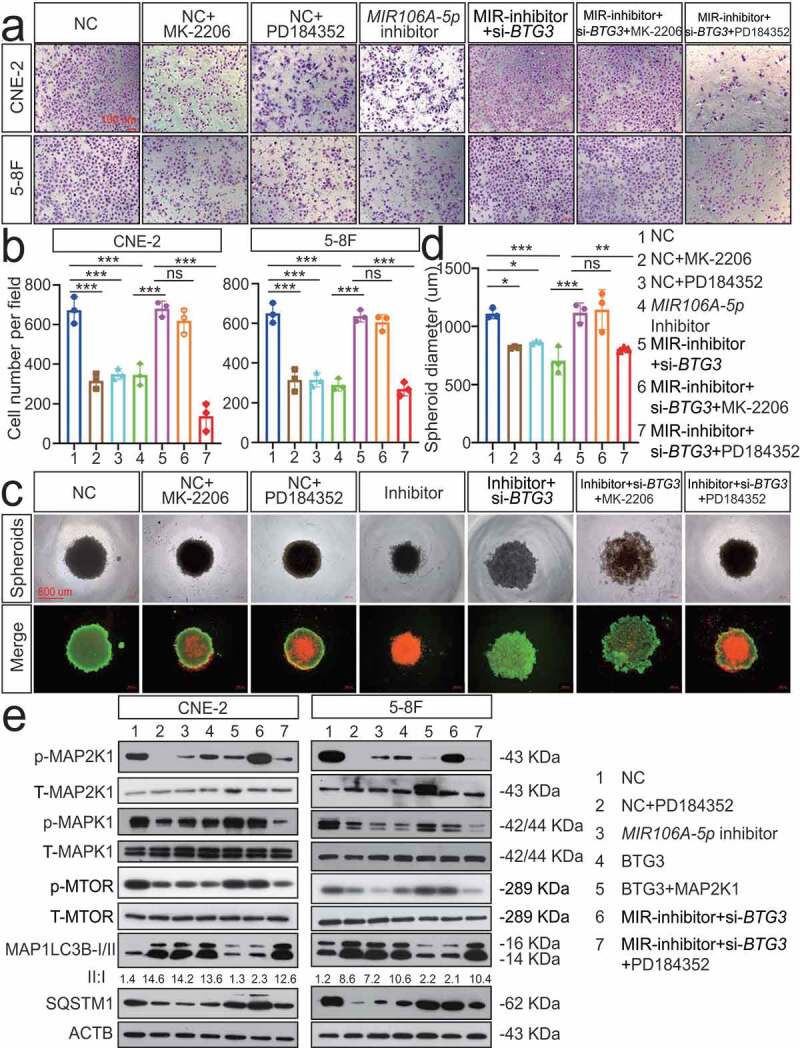
Figure 8.

The MIR106A-5p-BTG3 axis regulates NPC cell autophagy by activating MAPK signaling. Rescue experiments with Transwell assay (A-B) and three-dimensional spheroid formation assay (C-D) were performed using inhibitors of AKT and MAPK signaling using MIR106A-5p-silenced NPC cells transfected with BTG3-specific siRNA or control. MK2206: AKT inhibitor. PD184352: MAP2K1 inhibitor. (B) The number of cells that invaded through the membrane was counted in 3 fields per group with three independent replicates (***P < 0.001, one-way ANOVA). Data represent mean ± SEM. (D) Spheroid diameters were analyzed using one-way ANOVA (*P < 0.05, **P < 0.01, ***P < 0.001, scale bar: 600 μm). (E) Rescue experiments with WB analysis of p-MAP2K1/MAP2K1, p-MAPK1/MAPK1, and p-MTOR/MTOR levels, as well as autophagy-related gene levels, in different conditions in NPC cells. PD184352: MAP2K1 inhibitor, BTG3: BTG3 overexpression vector, MAP2K1: MAP2K1 overexpression vector. All experiments were repeated three times with similar results. Images in A, C, and E are representative of three independent experiments. Data represent mean ± SEM. All spheroid formation images of three independent experiments in C are shown in Fig. S8. Unprocessed original scans of three independent blots are shown in Fig. S9
