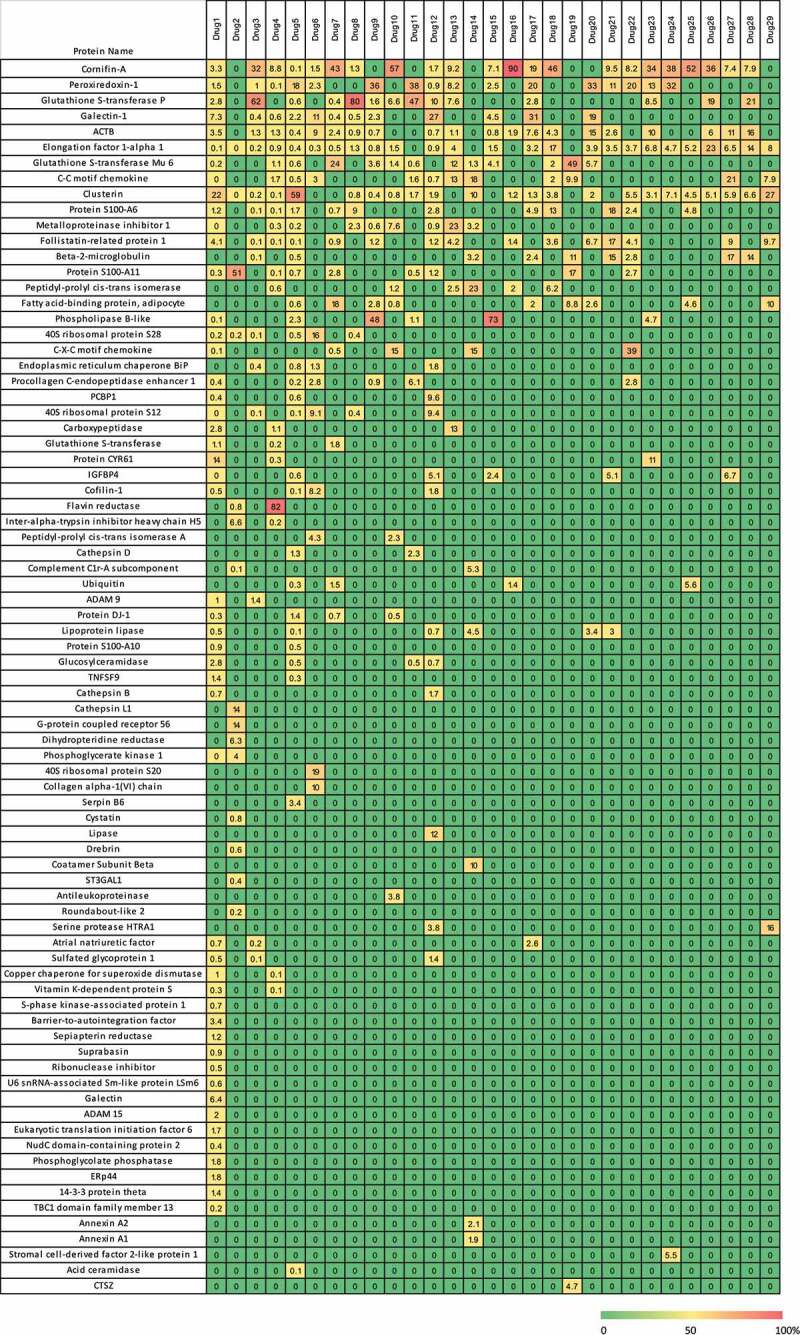
Figure 3.

Heatmap of HCP in percent abundance within each individual therapeutic protein. Each column represents the data from an individual therapeutic protein. Each row is an individual HCP identified in the current analysis. Each individual HCP amount was divided by the sum of HCP identified for that product and multiplied by 100 to give a fractional abundance. The heatmap was colored by the HCP fractional level, where red is 100% of the HCP profile contributed by one protein and green indicates that the HCP was not detected
