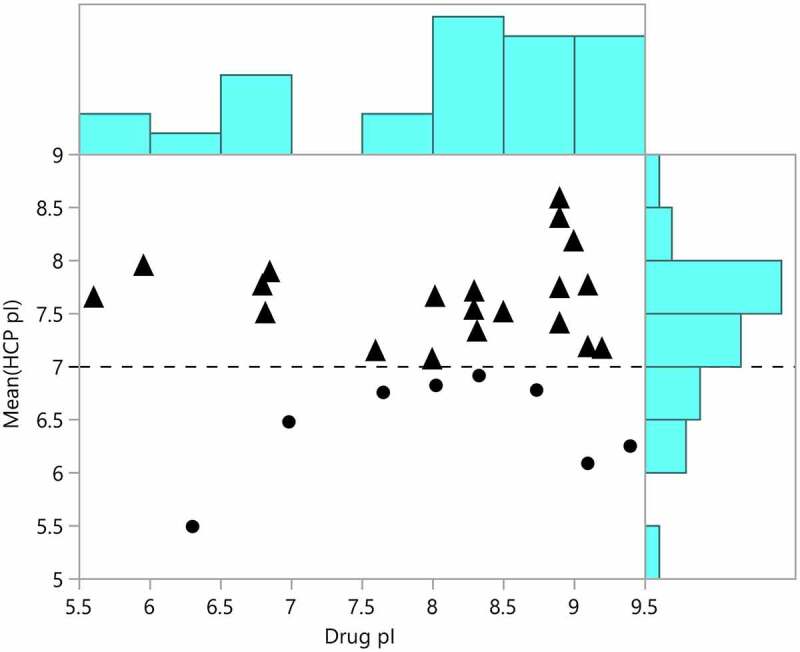
Figure 7.

Mean predicted host cell protein isoelectric points plotted against the predicted isoelectric points for approved therapeutic proteins. Mean HCP pI greater than 7 are marked with triangles and mean pI less than 7 are marked with dots. The distributions of drug and HCP isoelectric point are shown in blue on the borders of the plot
