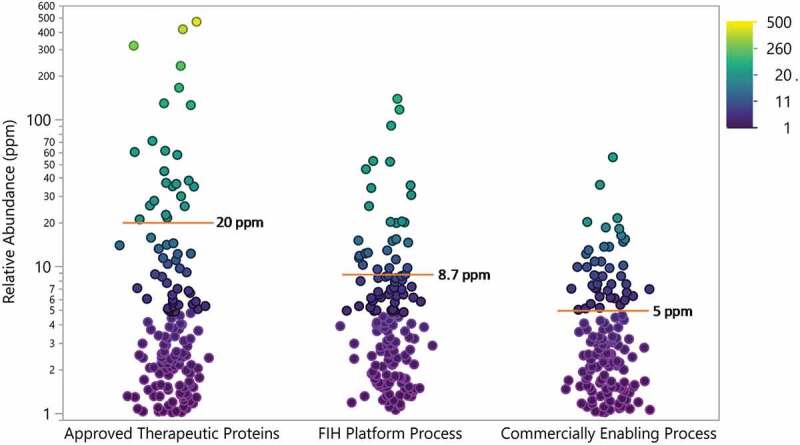
Figure 9.

Relative abundance of all HCP identified in approved therapeutic proteins (N = 28) and proteins (N = 12) produced in house using a first-in-human (FIH) platform process and commercially enabling process. Points are colored by relative abundance. Mean is indicated by red line and annotated. Drug 1 was not included in this analysis
