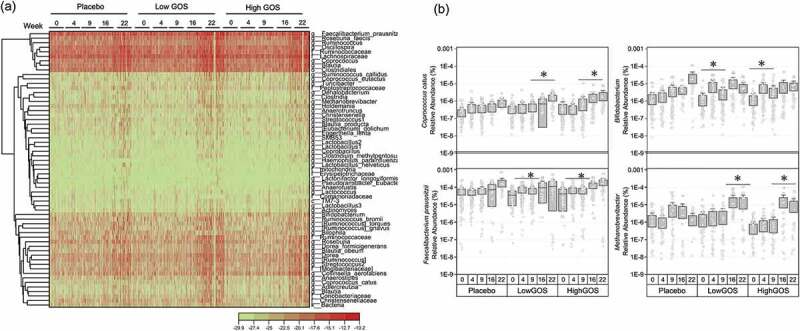
Figure 2.

(a) Representation of taxa at genus level differentially represented in at least one group and one time point (FDR corrected Kruskal-Wallis P <.05). The heatmap was generated using log2-transformed data in the Heat Map with Dendrogram app within OriginPro 9.7.5.184. (b) Relative abundance by treatment of Coprococcus catus, Bifidobacterium, Faecalibacterium prausnitzii and Methanobrevibacterium over time (in weeks). *Kruskall-Wallis FDR-corrected p < .05
