Figure 1.

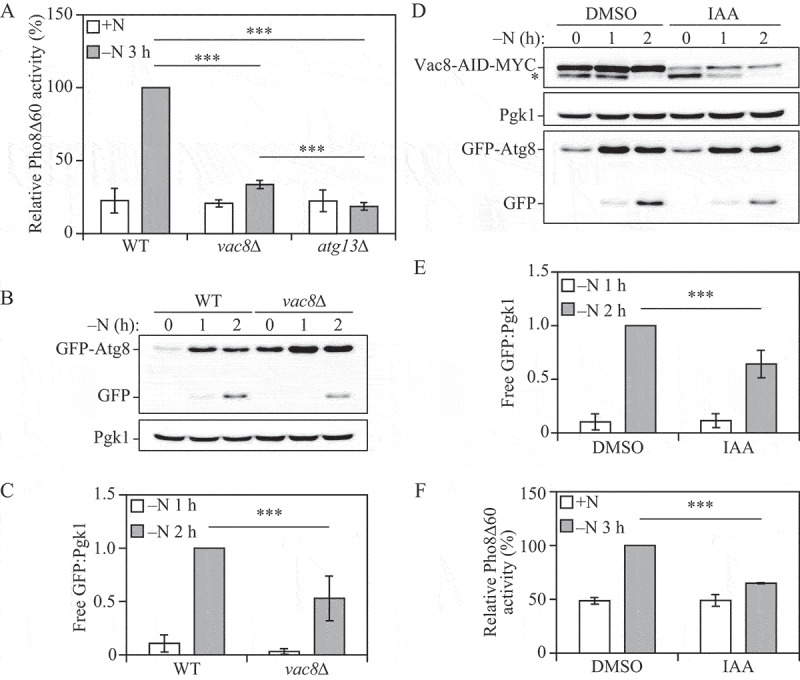
Vac8 is required for robust autophagy activity. (A) Autophagy activity was measured using the Pho8Δ60 assay in WT, atg13∆ and vac8∆ strains under nutrient-rich conditions (+N) and after 3 h of nitrogen starvation (-N 3 h). Error bars indicate the standard deviation of 3 independent experiments. ANOVA, ***P < 0.001. (B) Autophagy activity was measured with the GFP-Atg8 processing assay in WT and vac8∆ strains after 0, 1 and 2 h of nitrogen starvation (-N). A representative image based on detection with anti-YFP is shown. Pgk1 was used as a loading control. (C) Quantification of panel (B). The ratio of free GFP to Pgk1 after 1 and 2 h of nitrogen starvation (-N) is presented. Error bars indicate the standard deviation of 3 independent experiments. Student’s t-test, ***P < 0.001. (D) Autophagy activity was measured with the GFP-Atg8 processing assay in a Vac8-auxin-inducible degradation strain treated with DMSO (control) or auxin (IAA) for 30 min followed by 0, 1 and 2 h of nitrogen starvation (-N). A representative image is shown. The upper panel represents blotting with anti-MYC; the asterisk corresponds to a nonspecific band. Pgk1 was used as a loading control. (E) Quantification of panel (D). The ratio of free GFP to Pgk1 after 1 and 2 h of nitrogen starvation (-N) is presented. Error bars indicate the standard deviation of 3 independent experiments. Student’s t-test, ***P < 0.001. (F) Autophagy activity was measured using the Pho8Δ60 assay in a Vac8-auxin-inducible degradation strain treated with DMSO or IAA for 30 min in nutrient-rich conditions (+N) and after 3 h of nitrogen starvation (-N 3 h). Error bars indicate the standard deviation of 3 independent experiments. Student’s t-test, ***P < 0.001
