. 2021 Aug 10;10:e62997. doi: 10.7554/eLife.62997

Figure 3. Map of the spread of (A) artemisinin resistance (ART-R) and (B) dihydroartemisinin-piperaquine resistance (DHA-PPQ-R) in Asian countries.

Marker text and color indicate the proportion of sample classified as resistant in each province/state/division surveyed. A total of 6762 samples were included in (A) and 3395 samples in (B), after excluding samples with undetermined phenotype prediction. The results are summarized in Table 3.

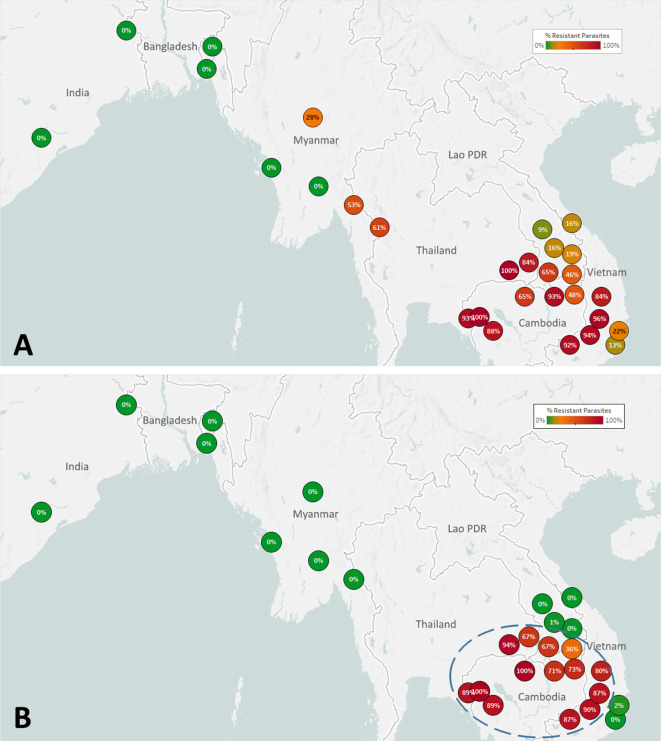
Figure 3—source data 1. Proportions of parasites predicted to be resistant to artemisinin and to the DHA-PPQ combination therapy in each province/state/division.

Figure 3.

Figure 3—figure supplement 1. kelch13 allele diversity in Asian countries.

Figure 3—figure supplement 1.

We show a pie chart for each province/state/division surveyed, indicating the relative proportion of different nonsynonymous mutations found in the resistance domains of kelch13. A total of 6758 samples were included in this analysis, after excluding samples where the kelch13 genotype could not be called, and those with undetermined ART-R phenotype prediction. For display clarity, mutations that we only found in singleton samples are also excluded (n=18).
Figure 3—figure supplement 1—source data 1. Sample frequencies for different kelch13 alleles at each province/state/division.
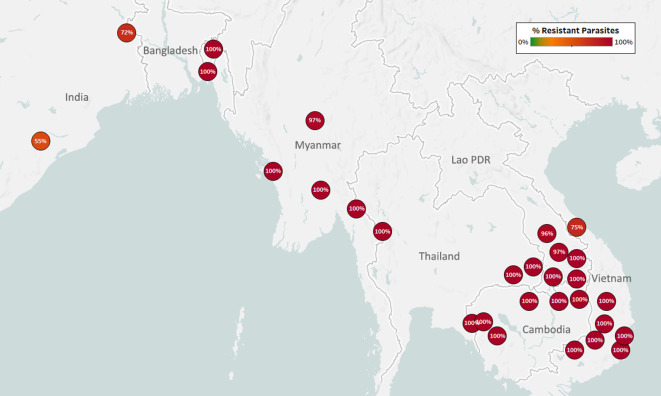
Figure 3—figure supplement 2. Map of Piperaquine Resistance (PPQ-R) in Asian countries.

Figure 3—figure supplement 2.

Marker text and color indicate the proportion of sample classified as resistant in each province/state/division surveyed. A total of 3552 samples were included in this analysis, after excluding samples where plasmepsin 2/3 copy number could not be determined. The results are summarized in Table 3.
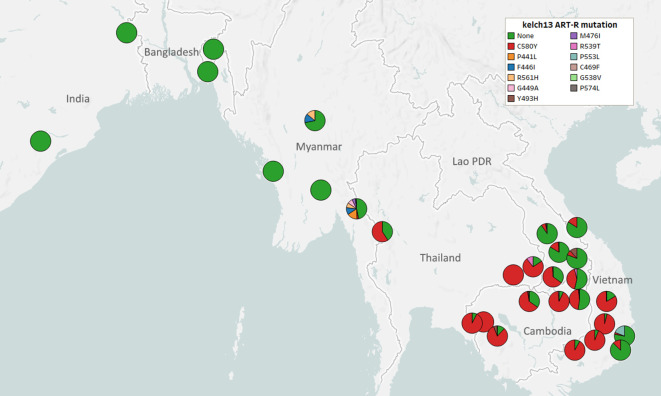
Figure 3—figure supplement 2—source data 1. Proportions of parasites predicted to be resistant to piperaquine in each province/state/division.
Figure 3—figure supplement 3. Map of Chloroquine Resistance (CQ-R) in Asian countries.

Figure 3—figure supplement 3.

Marker text and color indicate the proportion of sample classified as resistant in each province/state/division surveyed. A total of 6458 samples were included in this analysis, after excluding samples where the crt core haplotype could not predict a phenotype. The results are summarized in Table 3.
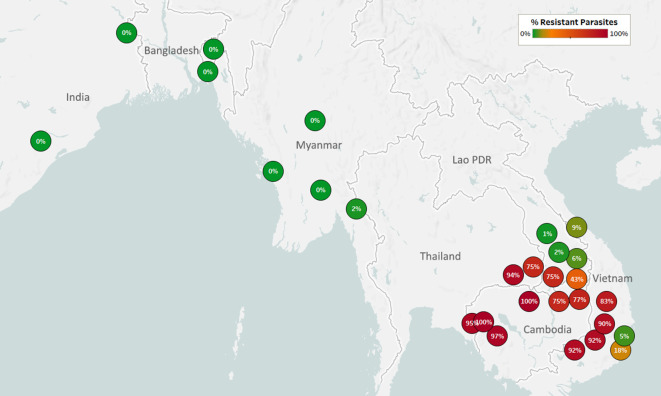
Figure 3—figure supplement 3—source data 1. Proportions of parasites predicted to be resistant to chloroquine in each province/state/division.
Figure 3—figure supplement 4. Map of Pyrimethamine Resistance (PYR-R) in Asian countries.

Figure 3—figure supplement 4.

Marker text and color indicate the proportion of sample classified as resistant in each province/state/division surveyed. A total of 7208 samples were included in this analysis, after excluding samples where the dhfr core haplotype could not predict a phenotype. The results are summarized in Table 3.
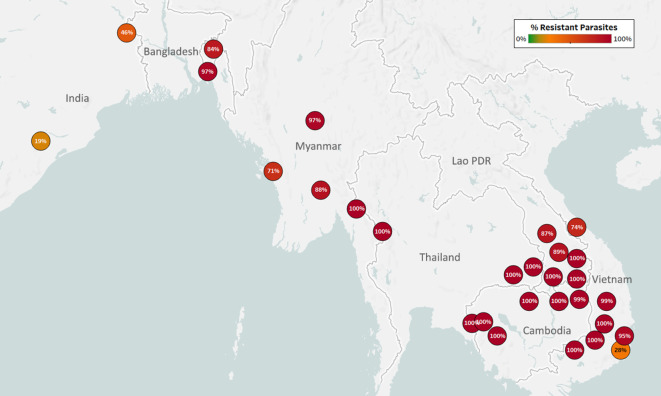
Figure 3—figure supplement 4—source data 1. Proportions of parasites predicted to be resistant to pyrimethamine in each province/state/division.
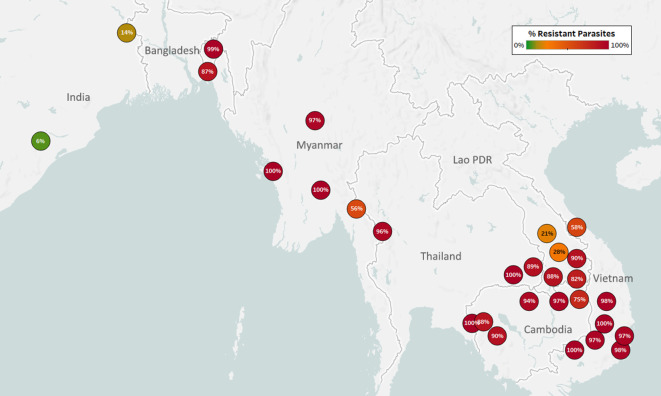
Figure 3—figure supplement 5. Map of Sulfadoxine Resistance (SD-R) in Asian countries.

Figure 3—figure supplement 5.

Marker text and color indicate the proportion of sample classified as resistant in each province/state/division surveyed. A total of 7095 samples were included in this analysis, after excluding samples where the dhps core haplotype could not predict a phenotype.
Figure 3—figure supplement 5—source data 1. Proportions of parasites predicted to be resistant to sulfadoxine in each province/state/division.