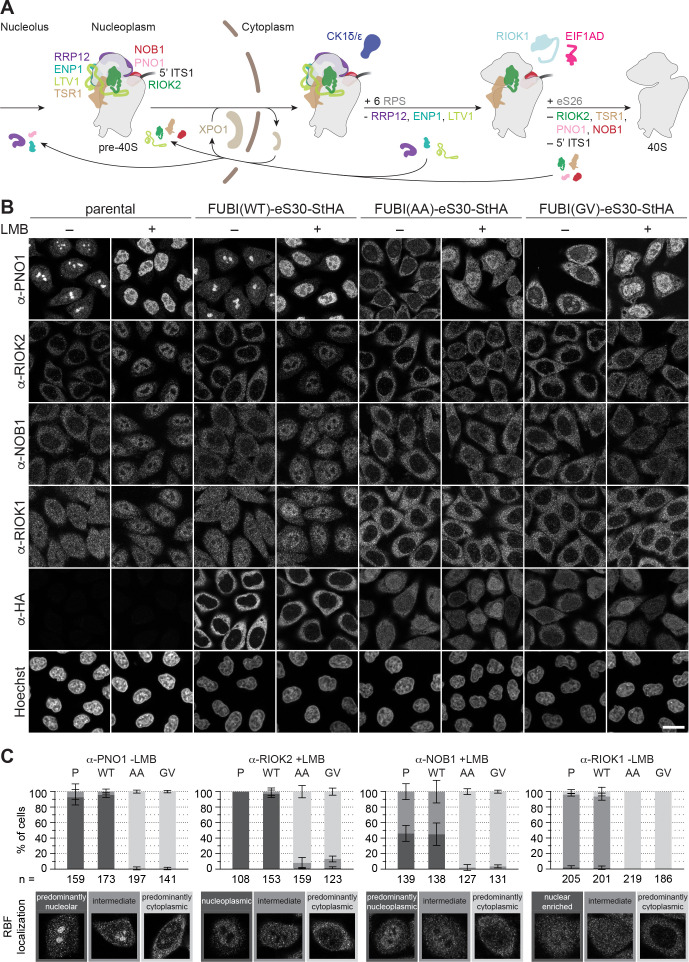
Figure 4. Non-cleavable FUBI-eS30 mutants have a dominant-negative effect on late cytoplasmic steps of 40S subunit biogenesis.
(A) Scheme of pre-40S maturation focusing on late nucleoplasmic to cytoplasmic maturation steps and highlighting the RBFs mentioned in the text. Nucleoplasmic pre-40S particles containing 18S-E pre-rRNA with its characteristic 5' ITS1 remnant and bound to various RBFs can be exported in an XPO1-dependent manner. In the cytoplasm, late-assembling RPS are incorporated, the 3' overhang of 18S rRNA is cleaved off by the endonuclease NOB1, and the RBFs are released and recycled. Together, these sequential maturation steps lead to the formation of a mature 40S subunit. (B) Immunofluorescence analysis of parental, WT or mutant (AA, GV) FUBI-eS30-StHA HeLa cell lines using the indicated antibodies against the constructs (HA) and the 40S RBFs PNO1, RIOK2, NOB1, and RIOK1. Note that HA and RIOK2 co-immunostaining was performed in parallel with Hoechst staining of DNA. Where indicated, cells were treated with leptomycin B (LMB; 20 nM, 90 min) to inhibit XPO1-mediated nuclear export prior to fixation of cells. Scale bar, 20 µm. (C) Quantification of RBF localization for selected conditions of the experiment shown in (B). Percentage of cells assigned to the respective phenotypic classes exemplified below was determined from three or in case of PNO1 -LMB four biological replicates for the indicated total number of cells per condition and cell line (n).


