Figure 2. Neutrophil diapedesis and NET formation on-chip.
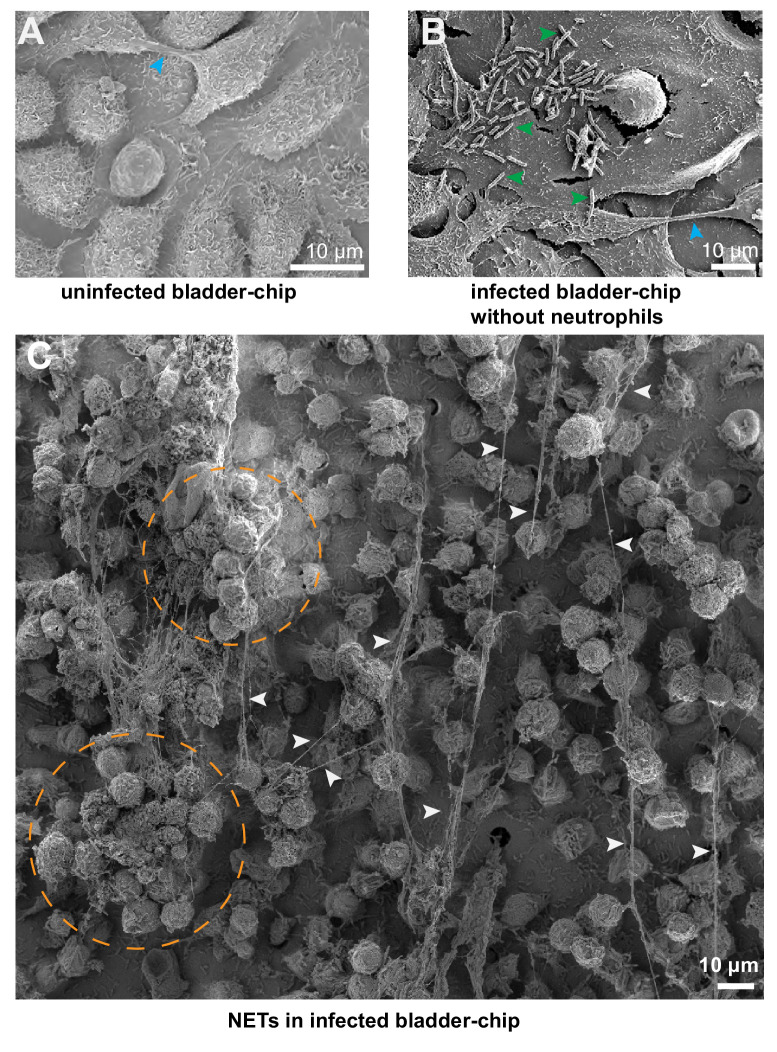
(A1–A5) Schematic of the UPEC infection, introduction of neutrophils and diapedesis of neutrophils across the epithelial-endothelial barrier to sites of infection. Flow in the epithelial and endothelial channels is indicated by arrows; the flow rate was increased upon introduction of neutrophils in the vascular channel to increase attachment. Increased flow rate in the epithelial and endothelial channel is indicated by black arrows. (B1–B5) Snapshots from time-lapse imaging highlighting each stage in the infection cycle shown in (A1–A5). Bladder epithelial cells (magenta) and neutrophils (amber) were identified with membrane (Cell Mask Orange) and cytoplasmic (Cell Tracker Deep Red) dyes, respectively. UPEC identified via constitutive expression of YFP are shown in green. Neutrophil swarms could either control bacterial growth (yellow dashed square, compare B4 vs. B5) or did not manage to restrict bacterial growth (white dashed square, compare B4 vs. B5). (C) Bar charts for relative frequency of neutrophil diapedesis (black) in n=three uninfected control bladder-chips and n=four infected bladder-chips. Data obtained from n=95 and n=116 fields of view, each of which was 206 x 206 μm2. (D) Quantification of the number of neutrophils detected on the epithelial layer, in control and infected bladder-chips. The red bar represents the median value, p<1E-15. In many instances in the uninfected control bladder-chips, no neutrophil diapedesis is detected. Data obtained from n=95 and n=130 fields of view, each of which was 206 x 206 μm2. (E) A plot of the maximum neutrophil swarm volume on the epithelial layer normalized to the total volume for n=67 and n=118 fields of view on n=three uninfected control and n=three infected bladder-chips. The red bar represents the median value. p<1E-15. (F) A plot of neutrophil swarm volume on the epithelial layer over time for n=51 and n=40 fields of view for n=two technical replicates indicated by squares and circles. For each time profile, the volume is normalized to the maximum volume attained over the timeseries and t=0 refers to the timepoint at which neutrophils are introduced into the vascular channel (G) Plot of the time to reach the maximum swarm volume in n=154 fields of view across n=four infected bladder-chips. (H1–H5, I1–I5) NET formation by neutrophils on the epithelial layer. The neutrophils are identified by a cytoplasmic dye (CellTracker Deep Red, false colored in amber) (H2, I2) and immunostaining with an anti-myeloperoxidase antibody (H3, zooms in H5) or an anti-neutrophil elastase antibody (I3, zooms in I5). Merged images in each case are shown in H4 and I4. UPEC identified via YFP expression is shown in spring green. Nuclear labelling with DAPI is shown in azure. (H5) NETs, identified via anti-myeloperoxidase staining or anti-elastase staining are indicated with white arrows in (H5) and (I5), respectively. (J1–J4) Scanning electron micrographs of the epithelial layer of an infected bladder-chip 2 hr after the introduction of neutrophils in the endothelial channel. (J1) Neutrophils (amber arrowheads) are visible above a layer of epithelial cells. Thick bundles consisting of many thinner NET structures between neutrophils are indicated by white arrowheads, and examples of individual UPEC bacteria within the NETs are indicated by green arrowheads. A heavily infected epithelial cell with UPEC visible on the epithelial cell (purple arrowhead), and appendages between epithelial cells (cyan arrowheads) are also visible. (J2) Micrographs showing thick bundles consisting of many thinner NET structures (white arrowheads) that extend between cells and trap many individual bacteria. Thinner NET fibers (yellow arrowheads) are also visible. (J3) Zooms of the regions in J2 identified by a yellow dashed square. Two bacteria held by a thick bundle composed of many thinner NET fibers are shown. (J4) Micrograph highlighting multiple bacteria trapped between NET bundles. p-Values in D and E were calculated using a Mann-Whitney test. Scale bar = 50 μm in B1–B5, H1-H5, I1-I5.
Figure 2—figure supplement 1. Quantification of UPEC attachment to bladder epithelial cells on-chip under flow.


