Figure 4. IBCs offer a semi-protective niche that delays clearance of bacteria by antibiotics.
(A1–A5) Bacteria persist and grow in IBCs despite antibiotic treatment. Snapshots show the growth of four IBCs with variable growth rates (A1–A2) indicated by yellow arrowheads. Ampicillin treatment eliminates some but not all of the bacteria within each IBC (A3). Growth resumes at all sites in (A4, A5), formation of new IBCs in the second growth cycle is indicated by white arrowheads. (B) Plots of logarithm of bacterial volume within five separate IBCs demonstrates exponential bacterial growth. IBCs are seeded dynamically; growth can occur either in the first or second growth cycle, or prior to the administration of antibiotic, or in few cases continues in the presence of the antibiotic. (C) Plots of the logarithm of bacterial volume vs. time for n=8 IBCs tracked across two growth phases with an intermediate period of ampicillin treatment. In the growth phases, growth is exponential and bacterial volume continues to increase for up to ca. 120 min after administration of antibiotic before declining due to loss of bacteria. In each case, growth resumes after the antibiotic is removed. (D) Scatter plots of the doubling time of bacterial volume in IBCs as measured in the first growth cycle (n=102) and the second growth cycle (n=59) from n = 3 bladder-chips. Growth in the second cycle is significantly slower (p=4.7E-7), red line represents the median value. (E) Doubling time of bacterial volume in IBCs in the first and second growth cycle for some of the IBCs in (D) that survived the antibiotic treatment. In n=16 out of 18 instances, growth is slower in the second growth cycle. (F1–F5) High-resolution time-series that highlights bacterial growth within an IBC prior to (F1, F2) and after (F3–F5) administration of ampicillin. Some bacteria within this IBC are subsequently eliminated (F5). (G1–G5) High-resolution time-series that highlights bacterial growth within an IBC prior to (G1, G2) and after (G3–G5) administration of ampicillin. The bacterial volume within this IBC is not diminished by antibiotic treatment (G5). (H) Plots of logarithm of bacterial volume within n=11 IBCs before, during, and after the second round of ampicillin treatment. (I) Plots of logarithm of bacterial volume within n=9 IBCs before, during, and after the second round of fosfomycin treatment. (J) Plot of the volume of extracellular bacteria upon antibiotic administration from n=103 fields of view, each of which was 206 x 206 μm2 in size, from n=3 bladder-chips. The bacterial volumes are normalized to the volume immediately prior to the antibiotic administration. (K) Scatter plot of the extracellular bacterial volume (n=105) and bacterial volume within IBCs (n=22) from n = 3 bladder-chips after ampicillin treatment and extracellular bacterial volume (n=101) and bacterial volume within IBCs (n=23) from n=1 bladder-chip after fosfomycin treatment as a fraction of the maximum bacterial volume prior to antibiotic treatment. Red line represents the median value, p=2.8E-4 (extracellular amp vs IBC amp), p=3.0E-5 (IBC amp vs. IBC fosfomycin) calculated using Kruskal-Wallis ANOVA Test, ‘ns’ represents p>0.05 (L, M) Representative images from the epithelial face of the infected bladder-chips with or without duty cycle, fixed at ca. 13.5 hr after UPEC infection and 6 hr into the first growth cycle. (N) Scatter plots of the logarithm of the total bacterial area across n=14 fields of view from infected bladder-chips with (n=2) and without (n=2) the application of the duty cycle, p = 8.6E-6. p-values calculated using a Mann-Whitney test. Yellow rectangular area in B, C, H and I represent the 1st and 2nd growth cycles. Gray rectangular area in B, C, H, I and J represent the rounds of ampicillin treatment. Scale bars, 10 μm in panels A1–A5, F1–F5, and G1–G5.
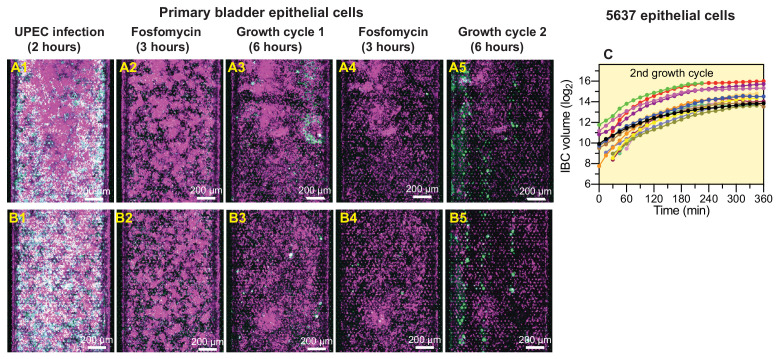
Figure 4—figure supplement 1. UPEC regrowth on-chip despite two consecutive periods of fosfomycin treatment.
Figure 4—figure supplement 2. UPEC growth in IBCs during ampicillin treatment.
Figure 4—figure supplement 3. UPEC infection leads to a higher bacterial burden in bladder-chips perturbed with duty cycle.


