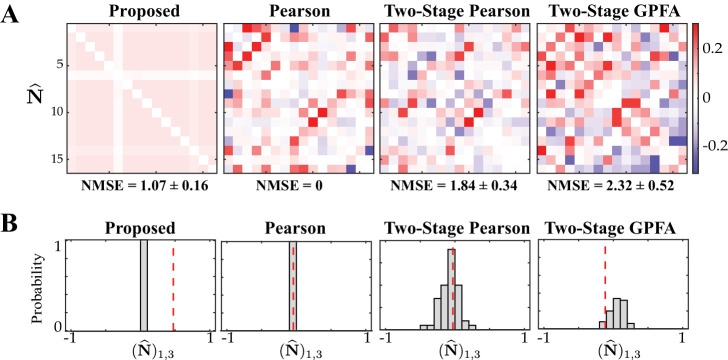
Figure 5. Assessing the specificity of different estimation results shown in Figure 4.
Rows from left to right: proposed method, Pearson correlations from two-photon data, two-stage Pearson and two-stage GPFA estimates. (A) The estimated noise correlations using different methods after random temporal shuffling of the observations. The mean and standard deviation of the NMSE across 50 trials are indicated below each panel. (B) Histograms of the noise correlation estimates between the first and third neurons over the 50 temporal shuffling trials. The estimate based on the original (un-shuffled) data in each case is indicated by a dashed vertical line.

