. 2021 Jun 28;10:e68046. doi: 10.7554/eLife.68046

Figure 6. Comparison of spontaneous and stimulus-driven activity in the mouse A1.

(A) A sample trial sequence in the experiment. Stimulus-driven (stim) trials were recorded with randomly interleaved spontaneous (spon) trials of the same duration. (B) Estimated noise and signal correlation matrices under spontaneous (top) and stimulus-driven (bottom) conditions. Rows from left to right: proposed method, Pearson correlations from two-photon data, two-stage Pearson and two-stage GPFA estimates. (C) Location of the selected neurons with highest activity in the field of view. (D) Stimulus onsets (orange), observations (black), estimated calcium concentrations (purple) and putative spikes (green) for the first trial from two pairs of neurons with high signal correlation (top) and high noise correlation (bottom), as identified by the proposed estimates.

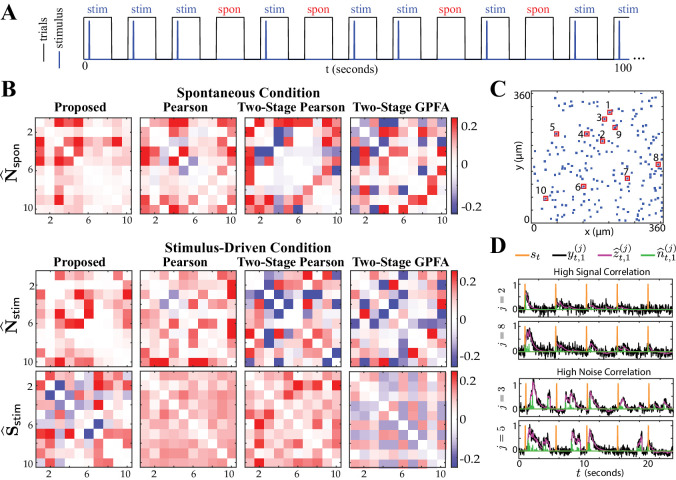
Figure 6.

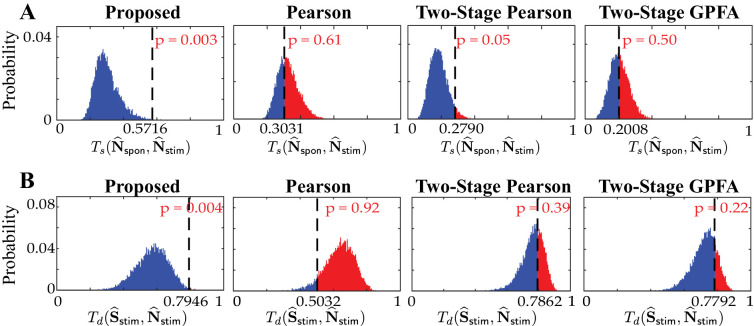
Figure 6β€”figure supplement 1. Histograms of the similarity/dissimilarity metrics under the shuffling procedure.

Figure 6β€”figure supplement 1.

Null distributions of (A) the similarities between ππ—Œπ—‰π—ˆπ—‡ and ππ—Œπ—π—‚π—† (top: Ts⁒(𝐍^π—Œπ—‰π—ˆπ—‡,𝐍^π—Œπ—π—‚π—†)) and (B) the dissimilarities between 𝐒^π—Œπ—π—‚π—† and 𝐍^π—Œπ—π—‚π—† (bottom: Td⁒(𝐒^π—Œπ—π—‚π—†,𝐍^π—Œπ—π—‚π—†)), obtained by the shuffling procedure applied to the results of real data study 2 in Figure 6. The observed test statistic in each case is indicated by a dashed vertical line. Rows from left to right: proposed method, Pearson correlations from two-photon data, two-stage Pearson correlations and two-stage GPFA estimates. These results show that the only statistically significant outcomes (with p≀0.05) are the similarities and dissimilarities obtained by our proposed method.